

We use cookies to ensure our website works properly and to personalise your experience. Cookies policy
Department of computer applications, Sandip Foundation’s Sandip Institute of Engineering & Management, Nashik-422013, India
There is a wealth of information available about students in colleges. This information is, however, usually kept in various spreadsheets, and looked at just once at the end of each semester. As a result, it is often too late to help those that are struggling. To overcome this issue, a College Academic Performance Dashboard has been developed using Microsoft Power BI. The data model contains 4 tables which are included on the Dashboard: Students, Courses, Grades, Semester_Summary. The dashboard includes measures to give an insight into the students’ academic performance. These are Average CGPA, Average SGPA, Pass Rate, Average Attendance, Total Backlogs and At Risk Students. There are 4 pages on the dashboard: Overview, Academic Performance, Attendance, and Risk. 1500 students were included in the data. The pass rate was 87.29%, the average CGPA was 7.03 and the average attendance was 77.91%. But 557 students had attendance below 75%. In addition, 516 students had backlogs and 607 students (40.47%) were identified as at risk. This dashboard illustrates that an average that is acceptable can be deceiving. This project has some restrictions, such as the definition of students' at-risk status. The dashboard gives some information regarding past performance and cannot predict the future.
All colleges keep records of their students. This comprises their score after each exam, attendance book daily and monitoring of the number of subjects they have failed in under the examination section. However, the issue is the data is rarely missing and is stored in separate files belonging to separate people. No one can keep a track of all the data throughout the semester.
Consequently, it takes considerable effort to answer even basic and simple questions like ‘what students are not doing well in the score and attendance aspects'. This means opening a few sheets and manually matching the student ID's. This is not something that will be done monthly by most teachers, so poor performance is usually identified only when the results come out.
Business intelligence tools were built to solve this kind of problem. One of the most popular of these is Microsoft Power BI. It is free to use, can import Excel and CSV files and does not require much coding to create a report that is interactive. In this project Power BI will be used to create a dashboard for a college. This is to present the academic achievement, attendance and backlogs at a glance.
Contributions:
This paper will be organized as follows: Background information will be given in Section 2. The problem and objectives will be explained in Section 3. In section 4, the data and methodology will be discussed. The dashboard will be discussed in Section 5. The results will be presented and discussed in Section 6. Recommendations will be included in Section 7, limitations will be explained in Section 8 and a conclusion will be given in Section 9.
2. Background and Related Work
The concept of using data to understand and enhance education has been around for some time. Romero and Ventura (2010) have conducted a review of the literature of Educational Data Mining to look at how educational data, like performance and engagement, can be used to predict learners' performance and alert those who may need attention. Learning Analytics is the understanding and enhancement of learning based upon learner data (Siemens and Long, 2011). However, the learner data needs to be considered as a living resource, not a by-product, in institutions.
Previous research has been conducted on dashboards. A systematic review was conducted on dashboards for learning by Schwendimann et al (2017) and a review of dashboards for students and recommender systems was undertaken by Bodily and Verbert (2017). This shows dashboards are a well established research field but there are still questions regarding dashboards' impact on teachers/students' work.
In addition, there has been some research into the presentation of information. A dashboard should be "skimmable" and thus, include only the most important information (Few, 2006). The chart should be designed for one clear message to the reader (Knaflic, 2015). This has been tried during the development of the dashboard pages.
From a technical point of view, Ferrari and Russo (2016) offer a hands-on guide to loading data into Power BI, modelling it and finally applying DAX.
3. Problem Statement and Objectives
Problem Statement:
The data is highly fragmented in academic level within a college and it is analysed after the end of the semester. This makes it difficult to identify any underperforming students, poor attendance and increasing backlogs.
Objectives:
4. Data and Methodology
4.1 Dataset and Data Model
The data for the dashboard was taken from a data set of 1500 students from 10 departments (Biotechnology, Business Administration, Civil Engineering, Commerce, Computer Science, Electrical Engineering, Mathematics, Mechanical Engineering, Physics and Psychology). There are students across all years (1-4) of the dataset with the following data:
This data has been organised into four tables. As illustrated in Table 1 below.
Table 1: Tables in data model
|
Table |
What it holds |
|
Students |
One row per student. Specifically includes StudentID, Department, Year_Level, Gender, Scholarship_Type, Status, Cumulative_GPA, and Attendance_Percentage. |
|
Courses |
Information relating to the course. Utilized to make calculations (Course name, Marks, Attendance, Results). |
|
Grades |
Marks, Grades and Result_Status (Pass/Fail) for each Course. |
|
Semester_Summary |
SGPA of each student per semester and SGPA of department per semester. |
Tables have been joined together using the student identifier. This means that if you filter on the slicer by department and year level, then all the tables will be filtered. The data was imported and cleaned using Power Query. This included basic cleaning such as fixing the data types, removing blanks and duplicates and ensuring consistent column names.
4.2 Derived categories
We did not report these raw scores (e.g. CGPA 7.4; attendance 72%) but rather grouped the scores into ranges:
4.3 DAX metrics
The values shown on the cards and charts are based on DAX metrics which are listed below in Table 2.
Table 2. Main measures used in the dashboard
|
Measure |
Purpose |
|
Total Students |
Number of students in the current selection |
|
Average CGPA |
Mean cumulative GPA |
|
Average SGPA |
Mean semester GPA |
|
Average Marks |
Mean marks across courses |
|
Pass Rate |
Share of course results that are passes |
|
Failed Courses |
Count of failed course results |
|
Average Attendance |
Mean attendance percentage |
|
Low Attendance Students |
Students under the low-attendance cut-off used in the report |
|
Total Backlogs |
Total number of active backlogs |
|
At Risk Students |
Students marked At Risk by the risk rule |
These are calculated measures and not fixed columns, which means that they will be recalculated every time a slicer changes. This is how the report is interactive.
4.4 Risk Identification
Not all students with a low CGPA will be at risk. Considering this, we analyzed CGPA, attendance and backlogs for risk. Those with a low value with multiple factors will be in a higher risk group. Overall there are three risk groups: Normal, Monitor and At Risk.
The scatter chart in attendance and risk shows attendance and cumulative gpa for all students. This makes it easy to identify outlier(s) if there are any.
5. Dashboard Design
This report is dark navy and has a navigation bar down the left. It has the same layout on each page and makes it easy to locate each page's contents. There are four buttons: Overview, Academics, Attendance and Insights. The slicers are either at the top or side of each page and allow filtering of data. The slicers are: Department, Year level, Gender, Semester, Student status.
5.1 Page 1: Overview
A quick overview of the whole college is given on the first page. There are four cards that display the following data: Total Students, Average CGPA, Average Attendance and Pass Rate. The charts below show the distribution of CGPA, students broken down by scholarship type, distribution of student status and the average CGPA per department (figure 1). This allows the head of department to view this page and quickly have an overall understanding of how the college is doing.
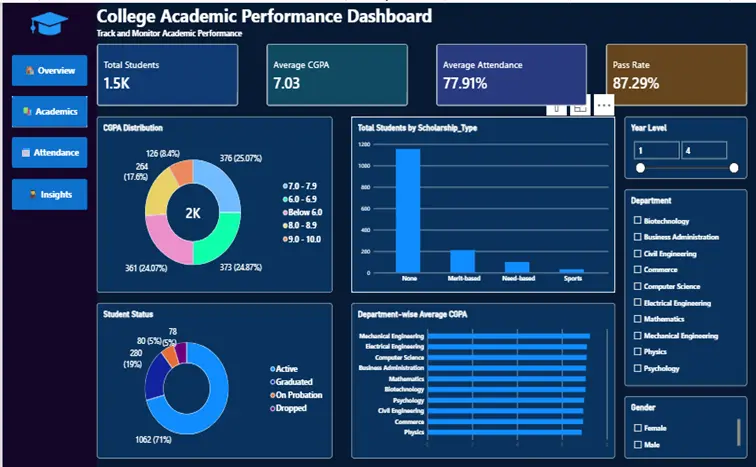
Figure 1. Overview page of the dashboard
5.2 Page 2: Academic Performance
This page provides more details about results. The cards will display Average SGPA, Average Marks and Failed Courses. The charts show semester-wise SGPA as a line, course-wise average marks, department-wise average SGPA, the grade distribution and the share of pass and fail results (Figure 2). The line chart shows whether performance is moving up or down from one semester to the next, and the course-wise chart shows which subjects pull the average down.
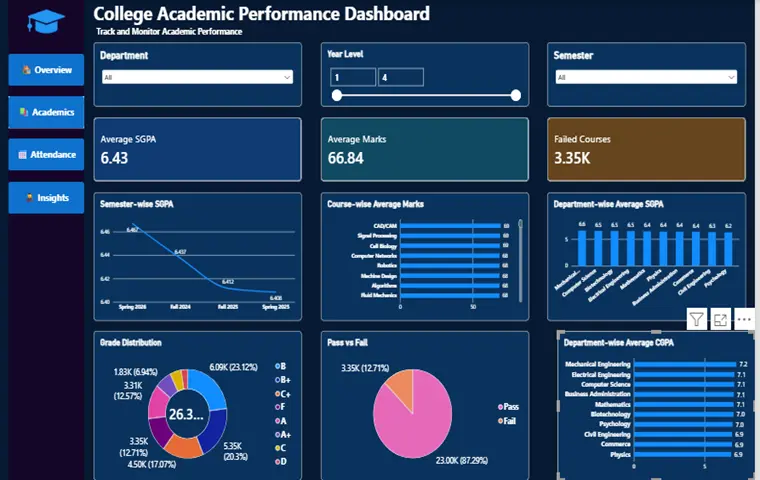
Figure 2. Academic Performance page
5.3 Page 3: Attendance and Risk
We believe that this is the most useful page for everyday use. Average Attendance, Low Attendance Students, Total Backlogs and At Risk Students are indicated on the cards. The charts depict attendance by department, attendance distribution, backlog distribution, the distribution of the students based on their risk status and a scatterplot of attendance vs. CGPA (Figure 3). A teacher can select a department and year level to see instantly how many students are short of attendance or carrying backlogs.
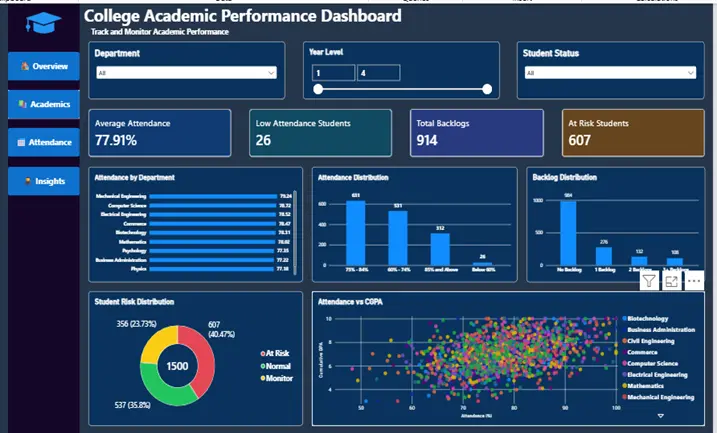
Figure 3. Attendance and Risk page
5.4 Page 4: Insights and Recommendations
The last page has no charts. It outlines the main findings about student achievement, attendance, active backlogs and student risk in simple language and then provides three recommendations with a brief summary of the overall objective (Figure 4). We included it because a dashboard with numbers only is open for interpretation by the reader, and many readers don't have the time for that.
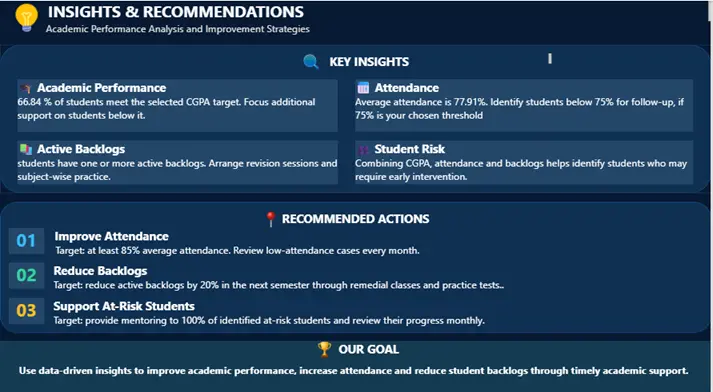
Figure 4. Insights and Recommendations page
5.5 Issues identified during the report creation
Whilst the report was fairly straightforward to create there were some minor issues that would have led to misinterpretation. Firstly the percentage format was incorrectly applied to the attendance card. This resulted in the percentage being displayed as 7791% instead of 77.91%. Secondly the semester names were in alphabetical order (Fall before Spring), meaning the line chart appeared to be decreasing when it wasn’t. To resolve this the semester x-axis will need to be ordered correctly using the date. Lastly the attendance ranges were in order of size. Whilst these are not major technical errors they would have caused confusion and therefore all visuals were carefully checked against the underlying data.
6. Results and Discussion
6.1 Key KPIs
Table 3 shows the key KPIs from the dashboard showing the values for all 1500 students without any slicers applied.
Table 3. Main indicators from the dashboard
|
Indicator |
Value |
|
Total students |
1,500 |
|
Average CGPA |
7.03 |
|
Average SGPA |
6.43 |
|
Average marks |
66.84 |
|
Pass rate (course results) |
87.29% |
|
Failed courses |
about 3,350 |
|
Average attendance |
77.91% |
|
Students below 60% attendance (Low Attendance card) |
26 |
|
Total backlogs |
914 |
|
Students marked At Risk |
607 (40.47%) |
6.2 Academic Performance
The pass rate was good at 87.29%, but it is estimated that approximately 1 out of 8 courses failed. The CGPAs are fairly evenly distributed with 376 students (25.07%) having a CGPA between 7.0-7.9, 373 (24.87%) between 6.0-6.9 and 361 (24.07%) between 8.0-8.9. However, there was a group of 264 students (17.6%) with a CGPA below 6.0 and only 126 (8.4%) students achieved a CGPA of 9.0 or above. This shows that roughly 82% of students obtained a CGPA of 6.0 or above, however 1 in 6 students were below this and will likely have required academic support.
The average CGPAs of students were very similar across the departments, ranging from 6.9 to 7.2, while the average SGPA ranged from 6.2 to 6.6. The range of the semester's SGPA is also quite small and lies between approximately 6.41 and 6.47. This suggests that there are no major differences between the departments and that the variations lay within individuals in each department. This helps to see the data from a personal point of view as illustrated on the following page. The average SGPA (6.43) is less than the average CGPA (7.03). These are based on separate tables and should not be directly compared as they represent an average of different records.
6.3 Attendance
The average attendance across the departments is 77.91% which is above the 75% criterion. The average is close for each department, ranging from 77% to 79%. However, if we look at the data it shows that there is definitely an issue. Of the 1500 students, 312 students have an attendance of 85 % or above, 631 students have an attendance of 75 % - 84 % and 531 students have an attendance of 60 % - 74 % and 26 students have an attendance of below 60 %. This equates to 557 students not reaching 75%, which is approximately 37% of students. The ‘Low Attendance’ card on the dashboard only lists the 26 students in the lowest attendance category (less than 60%) and therefore suggests that there is a comparatively small problem. This is the most important finding of this project. It shows that the average attendance may be satisfactory while many students are still falling short.
6.4 Backlogs
A total of 914 backlogs are running. There are 1500 students, 984 of which have no backlogs (65.6%), 276 students with one (18.4%), 132 students with two (8.8%) and 108 with three or more (7.2%). This is equivalent to 34% of students having 1 or more backlogs. There are two issues here; total number of backlogs and number of students. Generally, students with three or more backlogs will need one-to-one mentoring. But, if you have only one backlog you can gain from revision classes in that subject.
6.5 Overall Risk
607 students were identified as being at ‘At Risk’ (40.47%), 356 students as ‘Monitor’ (23.73%) and 537 students as ‘Normal’ (35.8%). Having such a high amount of students identified as at risk (40%) depends greatly on how strict the criteria was. The ‘At Risk’ label is used as a way of finding out who should be contacted first, not as a definitive answer. The scatter chart shows that there is a wide range of points with no obvious trend which means that having a low attendance does not necessarily mean they will have a low CGPA. This is another reason why multiple indicators were used.
6.6 Usability
All visuals are responsive to the slicers, which means that the same 4 pages can be utilized for the entire college, department or year. Anyone who knows how to use a dropdown can use this meaning we feel it is an advantage over static spreadsheets and print result sheets.
7. Recommendations
Based on the analysis carried out, three recommendations are given:
1. Increase the percentage of students in attendance to 85% or greater. Students with low attendance should be reviewed on a monthly basis.
2. Reduce Active Backlogs by 20% within the next semester. This can be done using remedial classes and practice tests.
3. Provide mentoring for students at risk. All students that are highlighted as being at risk must be provided with a mentor. They should be monitored monthly.
These recommendations are overall simple. They aim to increase academic achievement by providing the correct support to increase attendance and reduce backlogs.
8. Limitations
There were many limitations to this study:
9. Conclusion and Future Scope
In this paper we created a College Academic Performance Dashboard using Power BI. We were able to consolidate all information, such as marks, attendance and backlogs, in one place. With four related tables and four pages, faculty members can look at the whole college, a department or a year to find the students who might need assistance. The key statistics gained from the data of 1500 students indicate good performance, with a pass rate of 87.29%, an average CGPA of 7.03 and an average attendance of 77.91%. There were 557 students with less than 75% attendance, 516 with a backlog and 607 At Risk.
However we learnt that a dashboard should not have lots of charts but should give actionable information. Therefore, the last page provides unambiguous recommendations. We also learnt that the visuals need to be checked and compared with the figures. As small formatting or sorting errors can change the meaning.
This project can be worked out in various ways. Instead of having a specific rule, we can have a Machine Learning model (for instance Logistic Regression or Decision Tree) that would predict the odds of the failure. The correlation between attendance and CGPA could be calculated. The data could be automatically updated from the college portal. The report might be deployed to Power BI Service with row level security to enable teachers to only see their own classes. Sending notifications via email or messages would be more helpful for students who cross the attendance threshold.
Acknowledgements
I wish to express my gratitude towards Dr. Ganesh Ragde for their guidance during this project. I would also like to thank the members of the Department of Computer Applications who suggested that I write this project as a research paper.
REFERENCES


Harshada Bedse*, Pushpaj Mistari, Dr. Ganesh Ragade, Design and Implementation of an Interactive Power BI Dashboard for Monitoring Academic Performance, Attendance and Student Risk in a College, Int. J. in Engi. Sci., 2026, Vol 3, Issue 11, 30-39. https://doi.org/10.5281/zenodo.24250172
 10.5281/zenodo.24250172