
We use cookies to ensure our website works properly and to personalise your experience. Cookies policy
DRDO -Vehicles Research & Development Establishment, Ahilyanagar -414006, India.
This study presents a comparative finite element-based investigation of the load-carrying capacity and failure behaviour of conventional steel beam and thick unidirectional carbon–epoxy (UD) laminated composite beam used in payload support applications. The structural system is analysed under two critical operational configurations, namely static and launch conditions. For the composite material, a detailed parametric study is performed by varying the number of plies along with multiple fibre orientation schemes to examine their influence on stress distribution and load-carrying capacity. Classical Lamination Theory (CLT) is employed to evaluate stiffness of thick laminae, and the results are validated through finite element analysis (FEA). Additionally, the Maximum Principal Stress criterion is adopted to assess failure in composite laminates. The results are systematically compared to highlight the effects of ply configuration and fibre orientation on structural performance and failure limits. The study demonstrates that UD carbon–epoxy thick laminae composite beam, when appropriately designed, can achieve enhanced load-carrying capacity relative to conventional steel beams for equivalent weight, thereby exhibiting a superior strength-to-weight.
Composite materials has created an increasing demand for structural systems that are lightweight, mechanically efficient, and capable of sustaining extreme loading and environmental conditions. Conventional metallic beams, typically manufactured from steel, aluminium and of their alloys, have been extensively used in military, missile platforms, and support structures due to their predictable isotropic behaviour and established design standards. However, metallic materials possess inherent limitations, including high density, fatigue degradation under cyclic loading, and limited capability for mechanical property tailoring. These limitations directly affect mobility, payload capacity, operational efficiency, and long-term durability in modern defence systems.
To overcome these drawbacks, Fibre reinforced composite materials have emerged as promising alternatives. Composite materials such as Carbon Fibre Reinforced Polymer (CFRP) and Glass Fibre Reinforced Polymer (GFRP) exhibit superior strength and stiffness compared to conventional materials, as reported by Ahamed et al. [1]. Their high strength-to-weight ratio enables significant mass reduction while enhancing structural load-carrying capacity. In defence applications, weight reduction directly contributes to increased payload capacity, extended mission range, improved manoeuvrability, and reduced fuel consumption. Several researchers have investigated the structural behaviour of composite beams under tensile, shear, and bending loads. Uttam and Subhas [2] described the anisotropic behaviour of laminated composites using Classical Lamination Theory (CLT). According to CLT, the global mechanical response of a laminate is governed by its stiffness characteristics, represented by the ABD matrix. Accurate evaluation of these matrices, as demonstrated by Eric and Jean [3], is crucial for predicting laminate deformation under combined loading conditions. Hao Jin et al. [4] proposed a novel method for determining the ABD matrix of woven composites and validated their results using finite element analysis (FEA). Similarly, Aditya A. Joglekar et al. [5] investigated the substitution of conventional materials with composites and employed analytical formulations of the ABD matrix, which form the basis for similar calculations in the present study. Further studies by Verma and Chariar [6] emphasized the importance of laminate stacking sequence, ply thickness, and fibre orientation in tailoring structural performance. Investigations involving modelling and finite element analysis by Pavol et al. [7] and Tiren et al. [8] have successfully captured the mechanical behaviour and response of composite structures under various loading conditions. Defence-specific applications further highlight the advantages of composite beam systems. In armoured military vehicles, the replacement of metallic structural members with composite beams has been explored to reduce overall vehicle mass while maintaining structural rigidity. Mikru et al. [9] suggested the integration of composite materials in defence systems, while Gunale and Sarang [10] demonstrated their applications across various military and aerospace domains. These studies indicate a clear transition from conventional metallic structures to advanced composite materials in modern defence engineering. Modern warfare scenarios often involve high-velocity impact and deep penetration of projectiles, necessitating advanced material modelling techniques. Dong Wook Lee [11] investigated such behaviour using nonlinear finite element analysis for composite materials. UD Carbon–epoxy prepreg composites are employed in the present study; therefore, their material characteristics and modelling approaches are of particular importance. Frosina Velichkovska et al. [12] conducted experimental investigations on carbon–epoxy prepreg composites and successfully evaluated their mechanical properties. Michelle Leali Costa et al. [13] carried out the study of Carbon–epoxy prepreg properties through rheometry for airspace system. Higher thickness composites are rare to be found in commercial used. The manufacturing of such unconventional laminae is possible in composites having GSM Fabrics 1-3 mm per ply like multiaxial stitched glass fabrics.
The present study investigates the feasibility of replacing conventional metallic beams with composite beams having higher thickness laminae for payload support applications. The comparative analysis is conducted to ensure accurate stiffness characterization and to evaluate the structural suitability of composite beams for future implementation in advanced defence systems. Although commercially manufactured composites have laminae thickness of order 0.1 mm or less, this study extends the investigation to thicker laminas, preferably greater than 2 mm, to assess their load-carrying capacity under static loading conditions. The manufacturing processes and practical constraints associated with such thick composite laminates are beyond the scope of the present work; only their structural performance and load-carrying capability are evaluated.
2. Mathematical formulations
2.1 Classical Lamination Theory
The mechanical behaviour of laminated composite is governed by the anisotropic properties of individual thin plies and their stacking sequence. In the present study, an orthotropic UD carbon–epoxy 395 GPa prepreg laminate is modelled using Classical Lamination Theory (CLT) to evaluate their equivalent stiffness and stress–strain response under applied loading. Each lamina is assumed to be a transversely isotropic under plane stress conditions. In the principal material coordinate system (1–2 axes aligned with fibre and transverse to fibre direction), the stress–strain relationship is expressed as:
σ1σ2τ12 Q11Q120Q21Q22000Q66
 ε1ε2γ12
 (1)
(1)
Where Q= Q11Q120Q21Q22000Q66 is called reduced stiffness matrix with Qij
 as the reduced stiffness coefficients. σ1,σ2
 ,τ12
,τ12 , ε1,ε2
 and γ12
 are stresses and strain in the lamina of laminated composite respectively. Further, Q11=E11-μ12μ21
 ,Q12=μ12E21-μ12μ21, Q21=μ21E11-μ12μ21
 , Q22=E21-μ12μ21
 , Q66 = G12 , where, E1 is longitudinal Youngs modulus (in direction 1), E2 is transverse Youngs modulus (in direction 2), μ12 is Major Poisson’s ratio and G12 is in-plane shear modulus (in plane 1-2) of lamina.
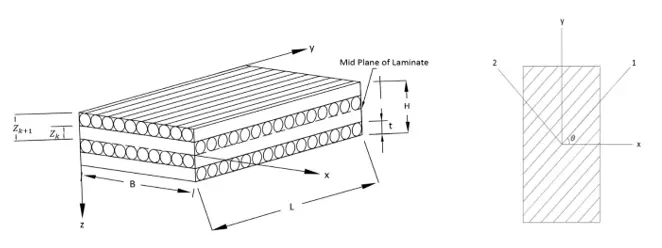
Figg.1: Schematic diagram of 4 ply Laminated composite.
In lamina, μ21 is minor Poisson’s ratio and follows relation E1μ12=E2μ21
 . For a general orthotropic laminate having laminae at any angle, Reduced transform stiffness matrix is the governing parameter given as Q
 = Q11Q12Q16Q12Q22Q26Q16Q26Q66
 Where, Qij are called the transformed reduced stiffness coefficients with
Q11 = Q11 c4 + Q22 s4 + 2(Q12+ 2Q66) s2c2, Q12
 = (Q11 + Q22 - 4Q66) s2c2 + Q12 (s4 + c4)
Q22 = Q11 s4 + Q22 c4 + 2(Q12 + 2Q66) s2c2, Q16
 = (Q11 - Q12 - 2Q66) c3s - (Q22 – Q12 – 2Q66) s3c
Q26 = (Q11 - Q12 – 2Q66) s3c - (Q22 – Q12 -2Q66) c3s, Q66
 = (Q11 + Q22 -2Q12 -2Q66) s2c2 + Q66 (s4 + c4)
Where, c= cosθ , s=sinθ
 and θ
and θ is angle of each lamina between their material axes and global axes as Shown in figure 1. When the laminate is subjected to a force or moment, the resultant forces and moments can be written in terms of the midplane strains and curvature as
NM = ABBD
 ε0k
ε0k (2)
(2)
Where, N denotes the forces, M denotes the Moments, ε0 is midplane strain and k is mid-plane curvature. Defining A, B and D matrices,
Aij=k=1nQijk(Z k - Z
k - Z k-1) Pa.m
Bij=12k=1nQijk(Z2 k - Z2
 k-1) Pa.m2
Dij=13k=1nQijk(Z3 k - Z3
 k-1) Pa.m3
NxNyNxyMxMyMxy =A11A12A16B11B12B16A12A22A26B12B22B26A13A26A66B16B26B66B11B12B16D11D12D16B12B22B26D12D22D26B16B26B66D16D26D66εx0εy0γxy0kxkykxy
 (3)
(3)
Here N and M with subscripts x, y and xy denoted forces and moments in that direction respectively. Same for the midstrain ε0 and curvature k . Further, the Strain calculation using below relation yields midstrain and curvature values,
ε0k = ABBD-1NM
 (4)
(4)
The strain at any distance z from midplane in the laminate is calculated using below relation.
εxεyγxy  = εx0εy0γxy0
 + z kxkykxy
 (5)
(5)
Then Principal strains and stress in lamina making an angle θ are calculated as,
ε1ε2γ122 = Tθ
= Tθ εxεyγxy2
 , σ1σ2τ12 = Q
 ε1ε2γ12 (6)
Where T is transformation matrix, Tθ = c2s22scs2c2-2sc-scscc2-s2
2.2 Maximum Principal stress theory
According to Maximum stress theory, failure in a lamina occurs when any of the principal stresses exceeds the corresponding allowable strength of the material in that direction. i.e.
σ1maxT < σ1uT
 , σ1maxC
 < σ1uC
σ2maxT < σ2uT
 , σ2maxC
 < σ2uC
(τmax ) < (τu
  )
)
σmax and τmax
 are maximum normal and shear stress in a lamina respectively. T and C being tension and compression respectively. U for maximum strength value fixed for a given material. if any of the above criteria is not satisfied, the lamina fails which in turn leads to failure of laminate.
3. Methodology
This study compares structural strength of carbon epoxy 395 GPa prepreg laminated composite beam to conventional steel beam in carrying Payload of different weight in two different loading modes. Other modes involve transportation or dynamic mode which is not part of this study. The configuration of beam during operation in 0 degree or static mode and 90 degree or launch mode are critical from operation point of view. The tilt beam needs to qualify in both modes for operation. During static mode, the tilt beam rest on the subframe of vehicle through front support and hinged support as shown in figure 2. On the other hand, during launch mode the weight of beam is fully supported by hinges shown in figure 3. Hence these two modes are focussed in this paper. The weight of payloads are taken based on available defence data. There is no change in length of payload and hence the CG of payload is fixed on the tilt beam for all weight of payload. The dimension and shape of tilt beam conforms to defence industries guidelines. Maximum normal stress (6) generated in composites is compared with maximum normal stress generated in steel to evaluate maximum carrying capacity of material before failure. It is assumed that there is perfect bonding between laminas in the laminate and there is no delamination and hence only in plane normal stresses in two mutually perpendicular direction is evaluated.

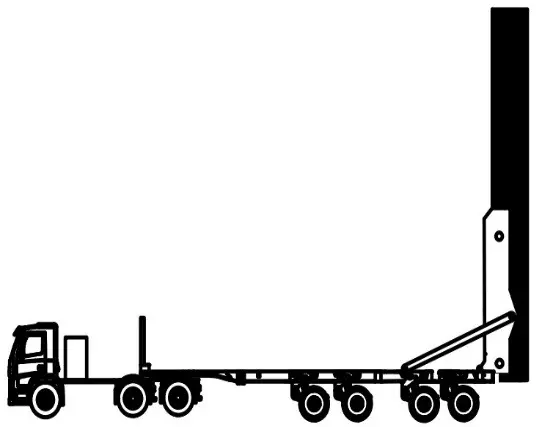
Fig. 2: Static mode of tilt beam. Fig. 3: Launch mode of tilt beam.
For comparison, a suitable criterion of evaluating the Factor of safety (FOS) is considered. For steel FOS is ratio of max stress generated due to loading to max permissible stress in the material. Hence Minimum FOS out of both mode of operation is evaluated. For composite there is no such criteria of FOS defined but, in this research, a hypothetical FOS is use for composite such that it denotes its capacity take load without any failure in the laminated composite. Since laminate is made up of different lamina and stress generated will be different in each lamina based on CLT theory, only maximum stress along fibre and transverse to fibre direction in any of the lamina either top or bottom or midway generated is considered. This is in good agreement with literature as failure of any lamina in any direction in laminate will lead to failure of composite. The present study deals with five stacking sequences selected randomly for 2, 3 and 4 ply of laminated composite. As the composite beam has to take load in two different loading mode shown in figure 2 and 3, a critical FOS which is minimum of FOS in all loading mode is defined.
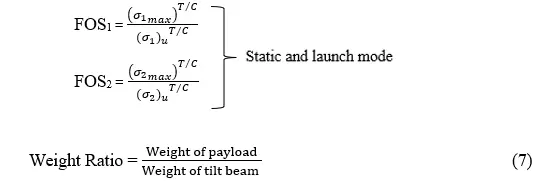
Critical FOS = min (FOS1, FOS2) in both modes. Here σmax is maximum stress (1, 2 being in fibre or transverse to fibre direction) in any of the lamina at any location within lamina in a laminate. FOS1 is the Factor of safety along fibre direction and FOS2 is Factor of safety transverse to fibre direction. A new parameter called weight ratio (7) is defined. It is used to compare the strength of tilt beam of two different materials in carrying payload. it indicates carrying capacity of payload per unit weight of tilt beam. An assumption of FOS greater than 1.5 is consider to be safe hence any loading mode of tilt beam giving FOS below this cut-off 1.5 is not accepted and unsafe for payload. The Finite Element analysis is carried out in Ansys Workbench and Ansys ACP pre/post module. Analytical results for validations are evaluated using MATLAB.
Numerical accuracy assessment
Composite laminates are characterised by the ABD matrix, which defines their extensional, coupling, and bending stiffness properties. Once the ABD matrix is obtained, Classical Lamination Theory (CLT) is used to evaluate the stress and strain distribution in each individual layer of the laminate. This theory is suitable for thin lamina composite and using 2D elements in FEA it was made suitable for thick laminae composite as 3D elements shows interlaminar stresses. To study the behaviour of the tilt beam with greater accuracy, a symmetric laminate composite rectangular plate of comparatively high thickness made of same material as tilt beam subjected to normal loading is modelled and validated using CLT. Analytical calculations are performed to determine the ABD matrix for the given geometry and boundary conditions, and the results are verified through Finite Element Analysis (FEA) using the Ansys ACP Pre/Post module. For validation, a transversely isotropic UD carbon–epoxy prepreg laminated composite specimen of dimensions 80 × 80 × 4 mm is modelled with a stacking sequence of [0/90/90/0], consisting of four laminae of comparatively high thickness of 1 mm.
Table 1: Properties of UD carbon epoxy 395 GPa prepreg.
|
Sr. No. |
Property |
Value |
|
1 |
E1 |
2.09X10¹¹ |
|
2 |
E2 |
0.0945X10¹¹ |
|
3 |
μ12 |
0.27 |
|
4 |
μ23 |
0.4 |
|
5 |
G12 |
0.055X10¹¹ |
|
6 |
ρ |
1540 Kg/m3 |
|
7 |
σ1uT |
1979X106 |
|
8 |
σ2uT |
26X106 |
|
9 |
σ1uC |
-893X106 |
|
10 |
σ2uC |
-139X106 |
Using material property and equations from section 2, the analytical method gives
Q0=2.096X10110.0255X101100.0255X10110.0948X10110000.055X1011 , Q90=0.0948X10110.0255X101100.0255X10112.096X10110000.055X1011
ABBD = 4.38X10110.102X101100000.102X10114.38X10110000000.22X10110000009.84X10110.136X101100000.136X10111.839X10110000000.293X1011
Using Finite element analysis in Ansys ACP module, the ABD matrix obtained is
ABBD =4.3834X10110.1024X10114.994X10-704.547X10-700.1024X10114.3834X10112.4019X10-54.547X10⁻⁷-3.63X10-604.994X10-72.4019X10-50.22X101100004.547X10-709.848X10110.1365X10111.665X10-74.547X10⁻⁷-3.63X10-600.1365X10111.840X10118.003X10-60001.665X10-78.003X10-60.2933X1011
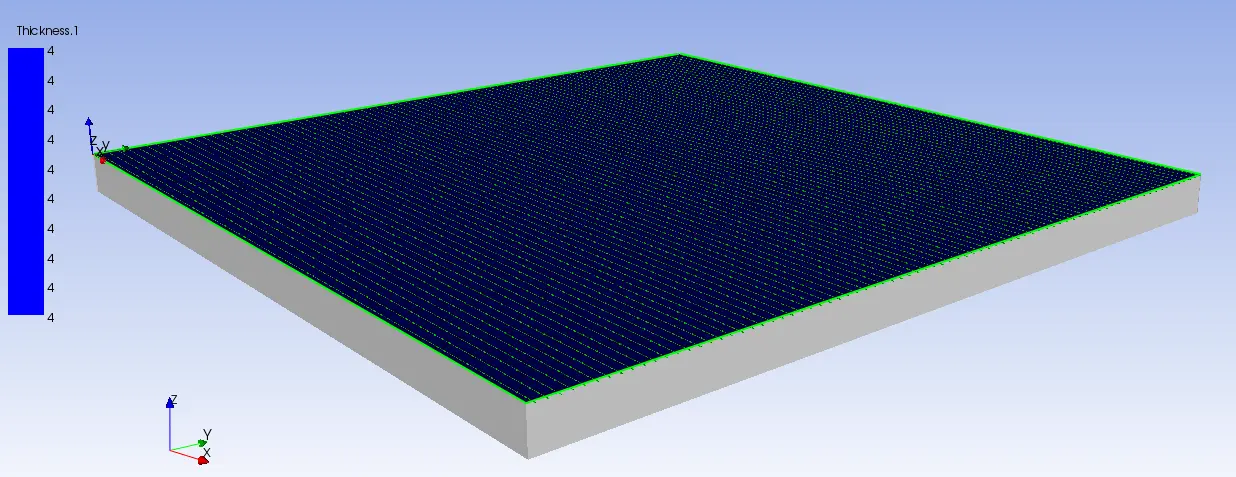
Fig. 4: FEA model of symmetric laminate composite rectangular plate.
The ABD matrix obtained through FEA is in good agreement with analytical results validating the use of CLT on comparatively higher thickness laminae as well as accuracy of Finite element modelling and analysis of composite in Ansys ACP tool.
5. Geometric and Finite Element Modelling
A tilt beam is a superstructure which holds the payload during operation. It’s a shape and size optimised mechanical structure having high strength and rigidity capable of holding payload without any mechanical failure. in this study a tilt beam shown in figure 5 having thickness of 10 mm and weight 1530 kg is taken into consideration. The CAD model of tilt beam shows two vertical sections joined using rectangular cross members. The cross members act as a mechanical coupler between section of tilt beam. there are two provisions in form of hole on the tilt beam to attach payload at the front and rear without having any load on cross members and whole assembly is hinged at rear on the subframe of vehicle through bottom hole on tilt beam. as payload is placed between two vertical sections of tilt beam shown in Figure 5 and transmits all the loads of payload from attachment points to hinge points, only these two vertical sections of tilt beam are considered for analysis and cross members are excluded.
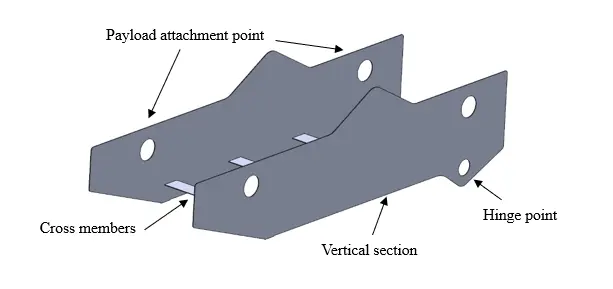
Fig. 5: CAD model of Tilt Beam.
It is assumed that the material of cross members may vary based on manufacturing constraint and its suitability to joined steel or composite vertical sections. Also, strength of tilt beam made up of composite will have less effect even cross members don’t make up of composites. same for steel tilt beam and hence it is excluded from this study. The dimension of tilt beam is shown in figure 6. For accurate comparison overall thickness of composite is kept similar to Steel beam i.e., in 2 ply laminated composite each lamina is of 5 mm thickness, in 3 ply 3.33 mm and 4 ply 2.5 mm thickness making overall thickness 10 mm. The weight of UD carbon epoxy laminated composite tilt beam is 300 Kg.
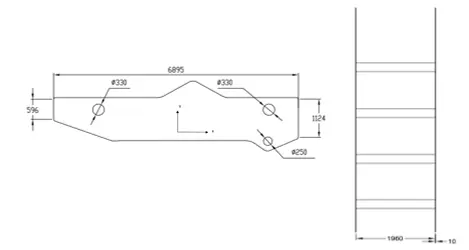
Fig. 6: Dimensions of tilt beam in mm.
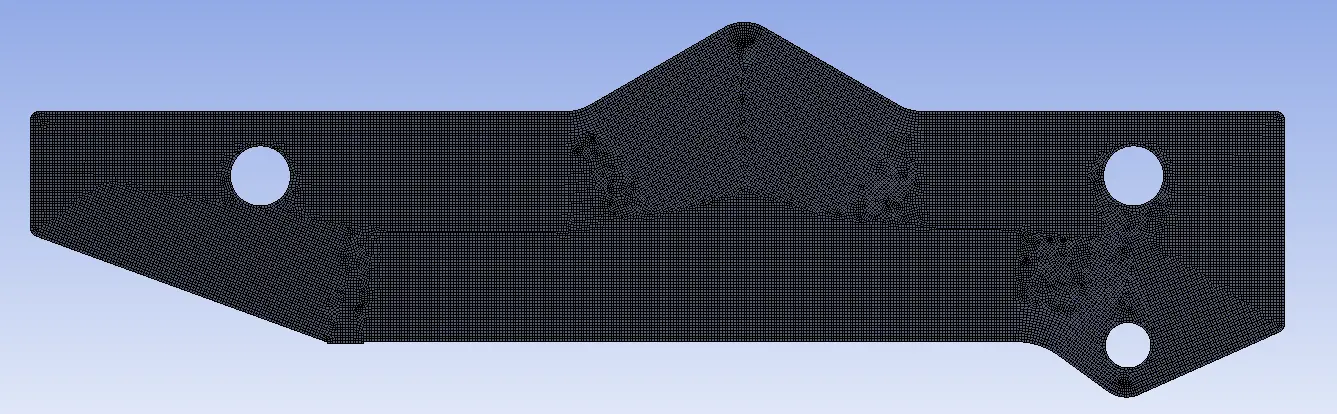
The CAD model is discretised into 621768 elements using 2D Quad 9 elements shown in figure 11. Use of 2D element removes interlaminar stresses and hence delamination stresses are not observed in FE analysis. This is completely in agreement with available literature. To achieve 2D meshing, mid surface of tilt beam is used. An optimum mesh size of 8 mm is selected based on a grid independence study, which indicates negligible variation in stress and deformation below this size. The same mesh configuration is used for both steel and composite models to ensure consistency. In static mode the tilt beam rest on the subframe of vehicle hence in FE modelling the front part of the tilt beam is fixed with all degrees of freedom restricted and hinged at rear by giving cylindrical joint. During launch mode, the tilt beam is completely supported on hinges, hence cylindrical joint as well as frictionless joint to restrict lateral movement and allow only rotation about the hinge axis is applied. Identical boundary conditions are applied for both materials.
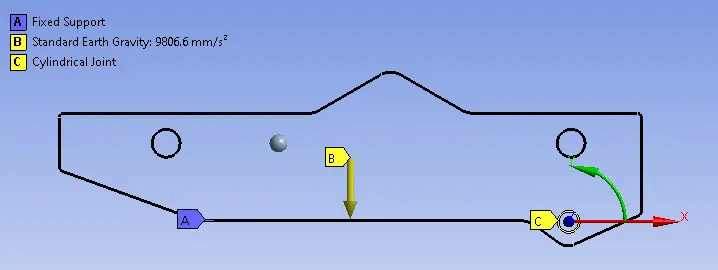
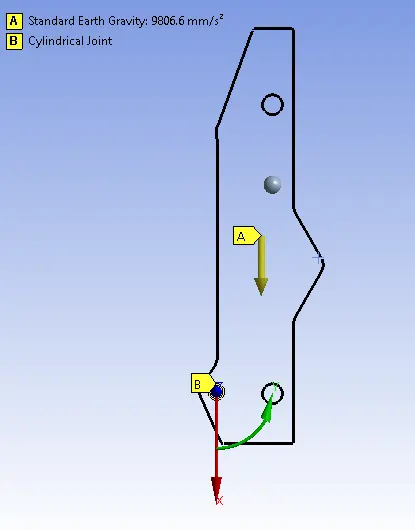
Fig. 8: Loading and boundary conditions in Launch mode.
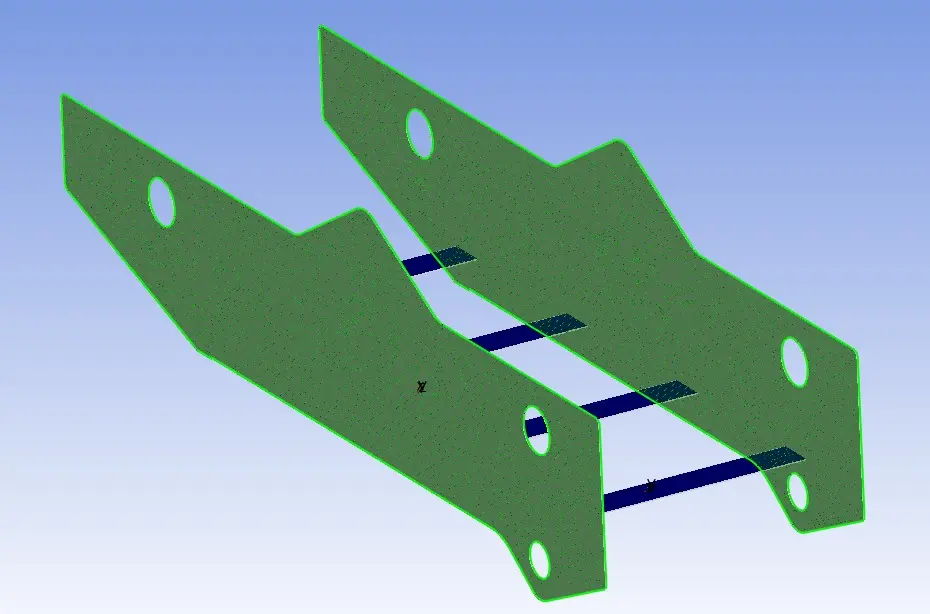

Fig. 9: FEA model of composite tilt Beam showing Fig. 10: Fibre in x axis of composite tilt fibres on vertical sections. beam.
Figg. 11: Mesh model of Tilt beam.
A 1g load is applied in both modes of operation in downward direction to carry out linear static stress analysis in both materials shown in figure 7 and 8. For steel von misses stress is measured and for composite maximum normal stress in both directions out of any of the lamina in laminate is measured. The payload is represented as a concentrated point mass applied at the attachment point corresponding to its centre of gravity which is 5 m from rear end of tilt beam. This load is distributed to the superstructure using RBE2 elements, ensuring uniform load transfer to the tilt beam. While designing composite, the fibres direction is made to coincide with global x axis of composite beam and transverse direction with y axis of tilt beam. z axis is the direction of thickness of composite.
6. Numerical Results
The stresses developed in the tilt beam in conventional material and UD carbon–epoxy prepreg laminated composite are presented in the table 2. The table further illustrates the load-carrying capacity of the steel tilt beam. It is observed that the steel beam exhibits higher load-carrying capacity in both modes of operation when compared to the laminated composite. The steel tilt beam can support a maximum payload of 40 tons with min FOS of 1.583, achieving a weight ratio of 26.14. As the payload increases, the minimum factor of safety (FOS) decreases. Data corresponding to FOS values below cut off 1.5 have not been included in the table for either the composite or steel configurations and simply shown by dash line. The accurate variation of FOS below 1.5 is depicted in Figure 13-15. The weight ratio is higher for composite materials compared to conventional steel material. For the 2-ply configuration, the stacking sequence [0/0], [90/90] and [0/90] achieves a maximum weight ratio of 33.33 and is suitable for carrying a payload upto10 tons. The stacking sequence [0/0] and [0/90] is found suitable for carrying a 12.5 ton and has weight ratio of 41.66. The maximum load-carrying capacity of the 2-ply UD carbon epoxy laminated composite is 12.5 ton. In the case of the 3-ply laminate composite, the stacking sequence [45/0/-45], [ 45/0/45], [ 90/0/90] and [0/90/0] is suitable for carrying payload upto10 ton giving maximum weight ratio of 33.33. Only [45/0/45] composite is suitable for 12.5 ton of payload with weight ratio of 41.66. for 4 ply laminate composites, stacking sequence of [0/90/90/0], [45/-45/-45/45], [0/45/-45/0] and [90/45/-45/90] is found to be suitable for 5 ton of payload with weight ratio of 16.66 and stacking sequence of [0/90/90/0] and [90/45/-45/90] for 10 ton of payload with weight ratio of 33.33. However, none of the evaluated stacking sequences are found to be suitable for higher payloads of 15 tons and more and hence the comparative study was stopped at this payload weight.
Table 2: Stress and FOS of steel tilt beam.
|
Sr. No. |
Weight (Ton) |
Max Stress (Von Mises) (MPa) |
FOS |
Min. FOS |
||
|
Static mode |
Launch mode |
Static mode |
Launch mode |
|||
|
1. |
5 |
54.93 |
65.06 |
12.56 |
10.60 |
10.60 |
|
2. |
7.5 |
79.09 |
91.55 |
8.72 |
7.53 |
7.53 |
|
3. |
10 |
103.25 |
118.04 |
6.68 |
5.8 |
5.8 |
|
4. |
12.5 |
127.41 |
144.52 |
4.77 |
4.55 |
4.55 |
|
5. |
15 |
151.57 |
171.01 |
4.55 |
4.03 |
4.03 |
|
6. |
20 |
199.89 |
223.97 |
3.45 |
3.08 |
3.08 |
|
7. |
25 |
248.21 |
277.00 |
2.77 |
2.491 |
2.491 |
|
8. |
30 |
296.54 |
329.91 |
2.32 |
2.09 |
2.09 |
|
9. |
40 |
393.13 |
435.85 |
1.75 |
1.583 |
1.583 |
Table 3: Stress and FOS of 2 ply laminate composite tilt beam.
|
Sr. No. |
2 Ply |
Payload Weight (5t) |
Min FOS |
|||||||
|
Static mode |
Launch mode |
|||||||||
|
σ1 |
σ2 |
FOS1 |
FOS2 |
σ1 |
σ2 |
FOS1 |
FOS2 |
|||
|
1. |
0/0 |
-89.79 |
-19.86 |
9.94 |
7 |
239.36 |
-33.125 |
8.26 |
4.19 |
4.19 |
|
2. |
90/90 |
-33.73 |
-25.79 |
26.47 |
5.387 |
-269.68 |
-22.2 |
3.31 |
6.26 |
3.31 |
|
3. |
0/90 |
-88 |
-3.5 |
10.14 |
39.71 |
-237.58 |
-27.39 |
3.75 |
5.07 |
3.75 |
|
4. |
45/-45 |
-108.05 |
-8.50 |
8.26 |
16.35 |
-292.4 |
29.41 |
3.05 |
0.88 |
--- |
|
5. |
45/45 |
-87.04 |
-18.85 |
10.25 |
7.37 |
207.27 |
28 |
9.54 |
0.92 |
--- |
|
Payload Weight (10t) |
||||||||||
|
1. |
0/0 |
-178.34 |
-38.193 |
5.00 |
3.63 |
469.05 |
-64.74 |
4.21 |
2.14 |
2.14 |
|
2. |
90/90 |
-66.459 |
-49.254 |
13.43 |
2.82 |
-527.97 |
-43.541 |
1.69 |
3.19 |
1.69 |
|
3. |
0/90 |
-170.51 |
-6.1667 |
5.23 |
22.54 |
-464.66 |
-53.57 |
1.92 |
2.59 |
1.92 |
|
4. |
45/-45 |
--- |
--- |
--- |
--- |
--- |
--- |
--- |
--- |
--- |
|
5. |
45/45 |
--- |
--- |
--- |
--- |
--- |
--- |
--- |
--- |
--- |
|
Payload Weight (12.5t) |
||||||||||
|
1. |
0/0 |
-222.62 |
-48.55 |
4.01 |
2.86 |
583.9 |
-80.55 |
3.38 |
1.72 |
1.72 |
|
2. |
90/90 |
-82.82 |
-60.02 |
10.78 |
2.315 |
-657.12 |
-94.21 |
1.35 |
2.56 |
--- |
|
3. |
0/90 |
-211.76 |
-7.62 |
4.217 |
18.21 |
-578.2 |
-66.659 |
1.544 |
2.085 |
1.544 |
|
4. |
45/-45 |
--- |
--- |
--- |
--- |
--- |
--- |
--- |
--- |
--- |
|
5. |
45/45 |
--- |
--- |
--- |
--- |
--- |
--- |
--- |
--- |
--- |
|
Payload Weight(15t) |
||||||||||
|
1. |
0/0 |
-266.9 |
-98.125 |
3.34 |
2.39 |
698.75 |
-96.37 |
2.83 |
1.44 |
--- |
|
2. |
90/90 |
-99.18 |
-72.7 |
9 |
1.91 |
-786.26 |
-64.88 |
1.13 |
2.17 |
--- |
|
3. |
0/90 |
-253.01 |
-9.2 |
3.52 |
15.10 |
-691.75 |
-79.48 |
1.39 |
1.74 |
--- |
|
4. |
45/-45 |
--- |
--- |
--- |
--- |
--- |
--- |
--- |
--- |
--- |
|
5. |
45/45 |
--- |
--- |
--- |
--- |
--- |
--- |
--- |
--- |
--- |
Table 4: Stress and FOS of 3 ply laminate composite tilt beam.
|
Sr. No. |
3 Ply |
Payload Weight (5t) |
Min FOS |
|||||||
|
Static Mode |
Launch mode |
|||||||||
|
σ1 |
σ2 |
FOS1 |
FOS2 |
σ1 MPa |
σ2 MPa |
FOS1 |
FOS2 |
|
||
|
1. |
0/45/90 |
-76.47 |
3.86 |
11.66 |
6.73 |
-328.89 |
35.15 |
2.71 |
0.74 |
--- |
|
2. |
45/0/-45 |
-124.71 |
-9.0 |
7.16 |
15.44 |
312.26 |
-35.86 |
6.33 |
3.87 |
3.87 |
|
3. |
45/0/45 |
-99.42 |
-8.45 |
8.98 |
16.44 |
-225.85 |
-33.719 |
3.95 |
16.4 |
3.95 |
|
4. |
90/0/90 |
-102.19 |
-7.59 |
8.73 |
18.31 |
-245.69 |
-18.418 |
3.63 |
7.52 |
3.63 |
|
5. |
0/90/0 |
-84.334 |
-7.89 |
10.58 |
17.61 |
-266.52 |
-25.825 |
3.35 |
5.38 |
3.35 |
|
Payload Weight (10t) |
||||||||||
|
1. |
0/45/90 |
--- |
--- |
--- |
--- |
--- |
--- |
--- |
--- |
--- |
|
2. |
45/0/-45 |
-239.22 |
-15.16 |
3.73 |
9.16 |
611.24 |
-70.18 |
3.23 |
1.98 |
1.98 |
|
3. |
45/0/45 |
-189.76 |
-12.55 |
4.70 |
11.07 |
-442.29 |
-65.93 |
2.01 |
2.1 |
2.01 |
|
4. |
90/0/90 |
-198 |
-13.8 |
4.51 |
10.07 |
-480.88 |
-36.23 |
1.85 |
3.83 |
1.85 |
|
5. |
0/90/0 |
-167.28 |
-15.47 |
5.33 |
8.9 |
-521.27 |
-50.506 |
1.71 |
2.75 |
1.71 |
|
Payload Weight (12.5t) |
||||||||||
|
1. |
0/45/90 |
--- |
--- |
--- |
--- |
--- |
--- |
--- |
--- |
--- |
|
2. |
45/0/-45 |
-296.48 |
-18.247 |
3.01 |
7.61 |
910.21 |
-104.5 |
2.17 |
1.33 |
--- |
|
3. |
45/0/45 |
-234.93 |
-14.602 |
3.80 |
9.51 |
-550.51 |
-82.04 |
1.62 |
1.69 |
1.62 |
|
4. |
90/0/90 |
-245.94 |
-17.01 |
3.63 |
8.17 |
-598.48 |
-45.106 |
1.49 |
3.08 |
--- |
|
5. |
0/90/0 |
-208.76 |
-19.266 |
4.27 |
7.21 |
-648.65 |
-62.847 |
1.37 |
2.21 |
--- |
|
Payload Weight (15t) |
||||||||||
|
1. |
0/45/90 |
--- |
--- |
--- |
--- |
--- |
--- |
--- |
--- |
--- |
|
2. |
45/0/-45 |
-353.74 |
-21.33 |
2.52 |
6.51 |
910 |
-104.5 |
2.17 |
1.33 |
--- |
|
3. |
45/0/45 |
-280.1 |
-16.651 |
3.18 |
8.34 |
-658.73 |
-98.15 |
1.35 |
1.41 |
--- |
|
4. |
90/0/90 |
-293.86 |
-20.14 |
3.03 |
6.90 |
-716.08 |
-53.98 |
1.24 |
2.57 |
--- |
|
5. |
0/90/0 |
-250.23 |
-23.05 |
3.56 |
6.03 |
-776.03 |
-75.188 |
1.15 |
1.84 |
--- |
Table 5: Stress and FOS of 4 ply laminate composite tilt beam.
|
Sr No. |
4 Ply |
Payload Weight (5t) |
Min FOS |
|||||||
|
Static Mode |
Launch mode |
|||||||||
|
σ1 MPa |
σ2 MPa |
FOS1 |
FOS2 |
σ1 MPa |
σ2 MPa |
FOS1 |
FOS2 |
|
||
|
1. |
0/90/90/0 |
-94.63 |
-5.08 |
9.43 |
27.36 |
-272.9 |
-19.73 |
3.27 |
7.04 |
3.27 |
|
2. |
45/-45/-45/45 |
-100.96 |
-4.7 |
8.54 |
29.57 |
243 |
16.57 |
8.14 |
1.56 |
1.56 |
|
3. |
0/45/-45/0 |
-93.48 |
-10.738 |
9.55 |
12.94 |
-284.66 |
31.31 |
8.67 |
12.38 |
8.67 |
|
4. |
90/45/-45/90 |
-102.96 |
-11.219 |
8.67 |
12.38 |
-251.32 |
-23.244 |
3.55 |
5.98 |
3.55 |
|
5. |
0/45/45/90 |
-80.165 |
4.51 |
11.13 |
5.76 |
-325.38 |
36.112 |
2.74 |
0.71 |
--- |
|
Payload Weight (10t) |
||||||||||
|
1. |
0/90/90/0 |
-187.43 |
-10.03 |
4.76 |
13.85 |
-533.85 |
-38.591 |
1.67 |
3.60 |
1.67 |
|
2. |
45/-45/-45/45 |
-187.68 |
-7.90 |
4.75 |
17.59 |
475 |
34.42 |
4.16 |
0.80 |
--- |
|
3. |
0/45/-45/0 |
--- |
--- |
--- |
--- |
--- |
--- |
--- |
--- |
--- |
|
4. |
90/45/-45/90 |
-200.8 |
-20.80 |
4.44 |
6.68 |
-491.94 |
-45.57 |
1.81 |
3.05 |
1.81 |
|
5. |
0/45/45/90 |
--- |
--- |
--- |
--- |
--- |
--- |
--- |
--- |
--- |
|
Payload Weight (12.5t) |
||||||||||
|
1. |
0/90/90/0 |
-100.97 |
-83.447 |
8.84 |
1.665 |
-215.39 |
-259.48 |
4.14 |
0.535 |
--- |
|
2. |
45/-45/-45/45 |
--- |
--- |
--- |
--- |
--- |
--- |
--- |
--- |
--- |
|
3. |
0/45/-45/0 |
--- |
--- |
--- |
--- |
--- |
--- |
--- |
--- |
--- |
|
4. |
90/45/-45/90 |
-87.437 |
-101.85 |
10.213 |
1.364 |
271.57 |
-237.22 |
3.288 |
0.5859 |
--- |
|
5. |
0/45/45/90 |
--- |
--- |
--- |
--- |
--- |
--- |
--- |
--- |
--- |
|
Payload Weight (15t) |
||||||||||
|
1. |
0/90/90/0 |
-280.24 |
-14.98 |
3.18 |
9.27 |
-794.79 |
-57.45 |
1.12 |
2.41 |
--- |
|
2. |
45/-45/-45/45 |
--- |
--- |
--- |
--- |
--- |
--- |
--- |
--- |
--- |
|
3. |
0/45/-45/0 |
--- |
--- |
--- |
--- |
--- |
--- |
--- |
--- |
--- |
|
4. |
90/45/-45/90 |
-298.64 |
-30.39 |
2.99 |
4.57 |
-732.57 |
-67.89 |
1.14 |
2.04 |
--- |
|
5. |
0/45/45/90 |
--- |
--- |
--- |
--- |
--- |
--- |
--- |
--- |
--- |
The maximum stress is obtained at fixed location in steel beam for static mode and at hinge location for launch mode. The stress distribution shown in figure 16 and 17 is due to 30 ton payload. This is in agreement with literature as these locations are restricted and eventually will have higher stresses compared to other location in the tilt beam. maximum stress in composite is obtained near fixed and attachment point of payload. The region of maximum stress due to 12.5 ton of payload in fibre as well as in transverse direction for [0/90/0] stacking sequence in both mode is shown in figure 18-21.
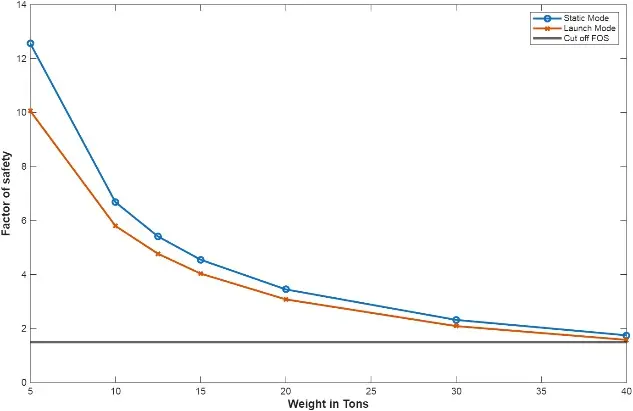
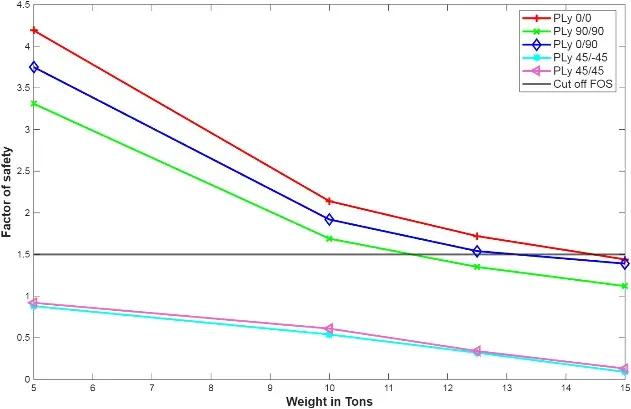
Fig. 12: Variation of FOS with weight in. Fig. 13: Variation of FOS with Weight in 2 steel Tilt beam Ply Composite Tilt beam.
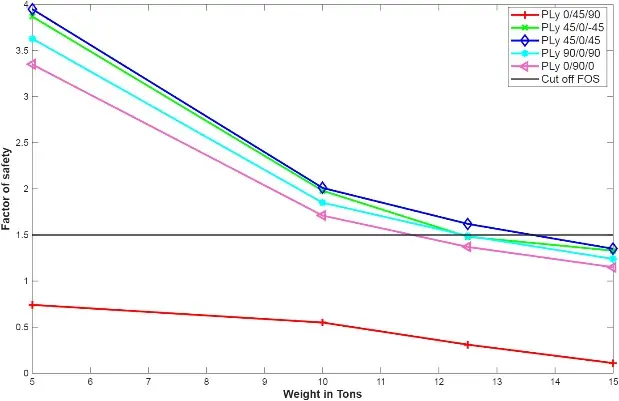
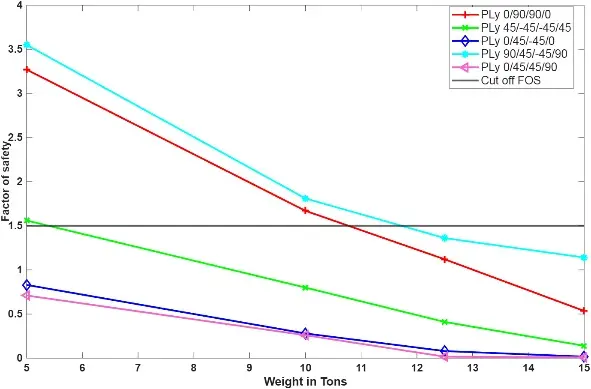
Fig. 14: Variation of FOS with Weight in 3 Fig. 15: Variation of FOS with Weight in 4 Ply Composite Tilt beam. Ply Composite Tilt beam.
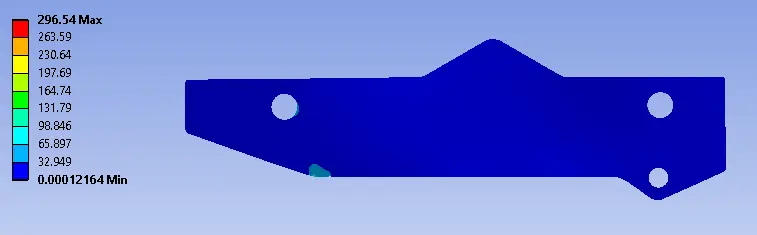
Fig. 16: Stress in Steel tilt beam in Static mode.
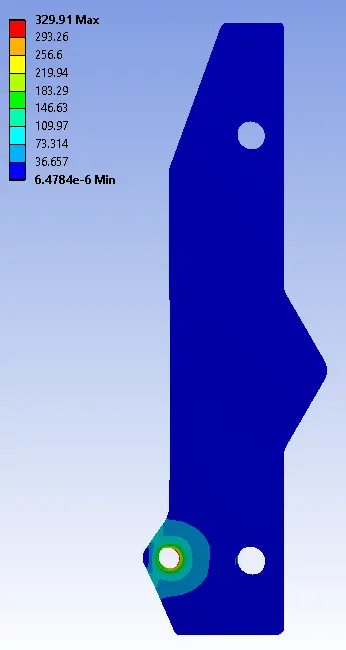
Fig. 17: Stress in Steel tilt beam in Launch mode.
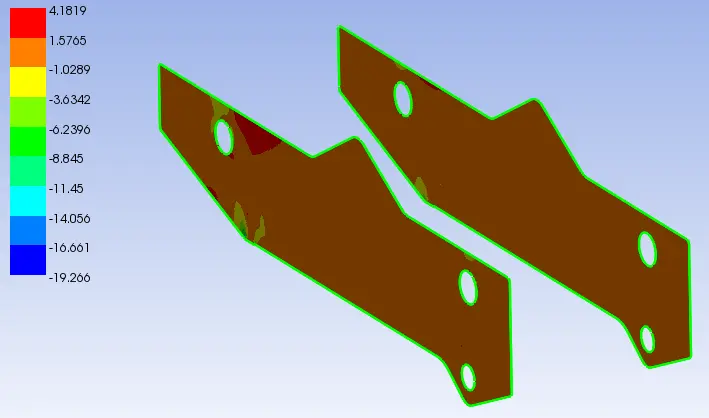
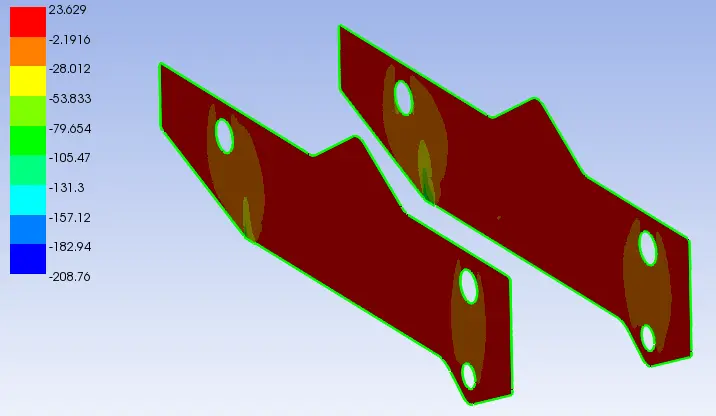
Fig. 18: Stress σ1

distribution in [0/90/0] composite
Fig. 19: Stress σ2

Tilt beam in static mode. composite tilt beam in static mode.
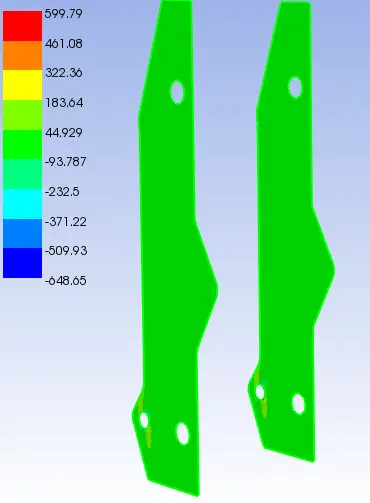
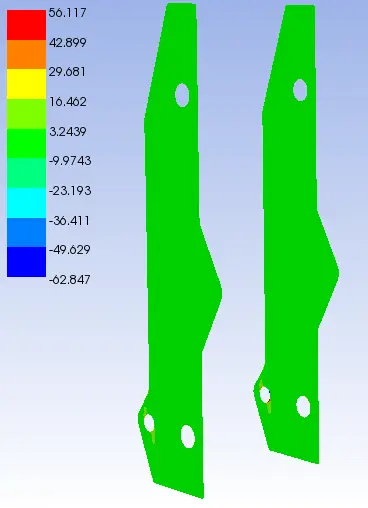
Fig. 20: Stress σ1
distribution in [0/90/0] composite Fig. 21: Stress σ2 distribution in [0/90/0]
Tilt beam in launch mode. composite tilt beam in launch mode.
7. CONCLUSION
This study presents an integrated approach combining material substitution with laminate parameter optimization to establish a direct comparative framework between steel and UD carbon–epoxy 395 GPa prepreg composite tilt beams under dual operational configurations. The results highlight the significant influence of ply orientation and stacking sequence on load-carrying capacity and failure limits. The use of Classical Lamination Theory (CLT) for analytical validation on the composites with higher laminae thickness, along with failure assessment based on the Maximum Principal Stress criterion, enhances the robustness of the analysis and offers practical design insights for developing lightweight and efficient load-bearing structures. the comparative study performed in this paper shows weight ratio of 3.26, 6.53 and 8.15 for steel tilt beam of weight 1530 kg against 5, 10 and 12.5 ton of payload respectively. On the other hand, a maximum weight ratio of 41.66 is obtained in UD carbon epoxy laminated composite tilt beam of weight 300 kg for stacking sequence and laminae thickness shown in table 2. In contrast to conventional composite designs that typically employ lower lamina thicknesses of order 0.1 mm and are commercially fabricated, this study demonstrates promising performance with comparatively higher lamina thickness, indicating its feasibility for heavy-duty applications. Defence vehicles often operate under high payload demands, which can push axle load ratings beyond safe limits and compromise vehicle and personnel safety. In such scenarios, the substitution of conventional materials with advanced composites presents a viable alternative. The UD carbon–epoxy 395 GPa prepreg configurations evaluated in this study show strong potential for replacing steel in critical applications, thereby reducing axle loading, minimizing failure risks, and enabling more efficient utilization of available weight capacity. Furthermore, advancements in manufacturing technologies supports the practical realization of composites with higher lamina thickness, making them suitable candidates for next-generation structural applications.
8. Acknowledgement
The authors would like to thank Defence Research and Development Organization for providing the facilities necessary to carry out this research. The authors would like to express their sincere appreciation to all individuals who provided valuable guidance and technical assistance during the course of this research. We are also grateful to colleagues and peers who offered constructive feedback and insightful discussions that contributed to the improvement of this study. The authors also acknowledge the use of publicly available data, tools, and resources that supported the completion of this work.
9. Conflict of interest
The authors declare that they have no known financial, professional or personal relationships that could have appeared to influence the research results, interpretations or publications reported in this paper.
REFERENCES

Abhishek Ranjan Singh*, Rishabh Singh, Yogesh Mahawar, Finite Element-Based Parametric Investigation of Load-Carrying Capacity of Thick Laminated Composite Beam for Payload Support Structures, Int. J. in Engi. Sci., 2026, Vol 3, Issue 7, 36-52. https://doi.org/10.5281/zenodo.21205302
 10.5281/zenodo.21205302


