

We use cookies to ensure our website works properly and to personalise your experience. Cookies policy
Civil Engineering Department, Sangam University, Bhilwara, Rajasthan.
Concrete is a mixture of cement, sand, aggregate, and water. High-strength concrete is that concrete which is a mixture of normal concrete with some chemical and mineral admixtures with the lowest water-cement ratio. High-strength concrete demands a lower water-cement ratio for long-term performance and durability. This paper presents the experimental study of fourteen mix designs targeting the M60 and M70 grade trial mixes proportioned as per IS 10262:2019, by binary and ternary blends at a water-cement ratio between 0.25 and 0.32. The only compressive strength was performed on cubes for 7, 14, and 28 days. Binder content shows the strongest positive results with 28-day strength. The ternary blends of 15% GGBS, 10% metakaolin, and 10% silica fume produced the highest 28-day strength. These results provide a quantitative basis for selecting additional cementing material combinations.
The concrete having more than 60 MPa, compressive strength that is called as High strength concrete. Increasing demand of modern infrastructure is increasing day by day and due to this the sustainable constructions plays important role. Very limited work is available for high grade of concrete [1,2]. HSC needs low water cement ratio increases the compaction risk. For developing sustainable HSC locally and easily available materials are taken such as silica fume, GGBS, metakaolin, fly ash. Silica fume and metakaolin was responsible for early age strength and GGBS reacts slowly and contributes later age strength. [1-6]
MATERIALS AND METHODS
MATERIALS
Ordinary Portland Cement (OPC 53 grade, Birla A1) conforming to IS 269:2015 was used as the primary binder. Class F fly ash, GGBS, densified silica fume and metakaolin were used as SCMs. Locally sourced river sand and manufactured crushed sand were used as fine aggregate, and crushed granite coarse aggregate of 20 mm and 10 mm nominal size was used in a 70:30 proportion by volume. A polycarboxylate-ether (PCE) based superplasticizer (Fosroc Auramix 400) was used to maintain workability at the low w/cm ratios required for HSC.
Material Characterisation
Prior to mix design, all constituent materials were characterised in accordance with the relevant Indian Standard test methods. Table 1 summarises the physical properties obtained for cement, fine aggregate and coarse aggregate.
Table 1: Physical Properties of Cement and Aggregates
| Property | Test Method | Result |
|---|---|---|
| Fineness of cement | IS 4031 (Part 1) | 1.375 % |
| Standard consistency of cement | IS 4031 (Part 4) | 32.3 % |
| Soundness of cement (Le Chatelier) | IS 4031 (Part 3) | 1.5 mm |
| Specific gravity – river sand | IS 2386 (Part 3) | 2.51 |
| Specific gravity – crushed sand | IS 2386 (Part 3) | 2.69 |
| Specific gravity – 10 mm aggregate | IS 2386 (Part 3) | 2.795 |
| Specific gravity – 20 mm coarse aggregate | IS 2386 (Part 3) | 2.85 |
| Water absorption – river sand | IS 2386 (Part 3) | 0.28 % |
| Water absorption – crushed sand | IS 2386 (Part 3) | 0.88 % |
| Water absorption – coarse aggregate (20 mm) | IS 2386 (Part 3) | 0.885 % |
| Grading zone of fine aggregate | IS 383:1970 | Zone II |
| Flakiness index of coarse aggregate | IS 2386 (Part 1) | 12.01 % |
| Elongation index of coarse aggregate | IS 2386 (Part 1) | 47.55 % |
| Los Angeles abrasion value | IS 2386 (Part 4) | 11.46 % |
| Aggregate impact value | IS 2386 (Part 4) | 8.70 % |
| Aggregate crushing value | IS 2386 (Part 4) | 14.27 % |
The fine aggregate sieve analysis showed 57.3% cumulative passing on the 600 µm sieves, placing the river sand within Zone II grading limits of IS 383:1970, which is considered favourable for HSC production.
Mix Design and Experimental Programme
Mix proportioning was carried out for a target grade of M70 following IS 10262:2019. The target mean compressive strength was computed using both the standard-deviation method (f’ck = fck + 1.65S) and a margin-based method (f’ck = fck + X), giving 79.9 MPa and 78.0 MPa respectively; the higher value of 79.9 MPa was adopted as the design target. A maximum free w/cm ratio of 0.33 was specified for severe exposure, and the final water content was reduced through superplasticizer dosage to achieve the low w/cm ratios listed in Table 2. Fourteen trial mixes were prepared, systematically varying the SCM combination (fly ash, GGBS, silica fume, metakaolin, used individually, in binary blends or in a GGBS-metakaolin-silica fume ternary blend), the total binder content (440-692 kg/m3) and the fine aggregate type (river sand or crushed sand), while coarse aggregate proportions and superplasticizer dosage were adjusted proportionally to each mix. The complete batch quantities, corrected for aggregate moisture, are summarised in Table 2.
Table 2: Mix Proportions of Trial Batches (kg/M3, Before Moisture Correction)
| Trial | Cement | Fly ash | GGBS | Metakaolin | Silica fume | Binder total(kg/m3) | Water(kg/m3) | w/cm | Fine aggregate |
|---|---|---|---|---|---|---|---|---|---|
| 1 | 352 | 62 | - | - | 26 | 440 | 140.8 | 0.320 | River + crushed (blend) |
| 2 | 352 | 62 | - | - | 26 | 440 | 140.8 | 0.320 | River sand |
| 3 | 376 | 66 | - | - | 28 | 470 | 141.0 | 0.300 | River sand |
| 4 | 495 | - | - | - | 55 | 550 | 148.5 | 0.270 | River sand |
| 5 | 495 | - | - | - | 55 | 550 | 148.5 | 0.270 | Crushed sand |
| 6 | 378 | 63 | 151 | - | 38 | 630 | 157.5 | 0.250 | River sand |
| 7 | 448 | - | 154 | - | 38 | 640 | 179.2 | 0.280 | River sand |
| 8 | 448 | 38 | 154 | - | - | 640 | 179.2 | 0.280 | Crushed sand |
| 9 | 448 | - | 192 | - | - | 640 | 179.2 | 0.280 | River sand |
| 10 | 448 | - | 192 | - | - | 640 | 179.2 | 0.280 | Crushed sand |
| 11 | 448 | - | - | 128 | 64 | 640 | 179.2 | 0.280 | River sand |
| 12 | 450 | - | 104 | 69 | 35 | 658 | 180.0 | 0.274 | River sand |
| 13 | 450 | - | 104 | 69 | 69 | 692 | 180.0 | 0.260 | River sand |
| 14 | 450 | - | 104 | 69 | 69 | 692 | 180.0 | 0.260 | River sand |
Specimen Preparation and Testing
For each trial mix, 150 mm cubes were cast, demoulded after 24 hours and cured in a water tank until testing. Three cubes were tested in compression at each of 7, 14 and 28 days using a calibrated compression testing machine in accordance with IS 516:1959, and the average of the three values at each age was taken as the representative compressive strength for that trial and curing period.
RESULTS AND DISCUSSION
Compressive Strength Development
Table 3 presents the average compressive strength obtained for all fourteen trial mixes at 7, 14 and 28 days, together with the percentage strength gain between 7 and 28 days and between 14 and 28 days. The 28-day compressive strength ranged from 42.99 MPa (Trial 1) to 85.20 MPa (Trial 14), a spread of 42.21 MPa across the data set, with a mean of 65.95 MPa and a standard deviation of 12.39 MPa (coefficient of variation ≈ 18.8%), reflecting the sensitivity of HSC strength to binder composition and proportioning within this experimental programme.
Table 3: Compressive Strength and Strength-Gain Statistics for All Trial Mixes
| Trial | 7-day(MPa) | 14-day(MPa) | 28-day(MPa) | Gain 7–28 d(%) | Gain 14–28 d(%) |
|---|---|---|---|---|---|
| 1 | 28.19 | 35.59 | 42.99 | 52.5 | 20.8 |
| 2 | 31.79 | 47.50 | 53.58 | 68.5 | 12.8 |
| 3 | 33.47 | 53.16 | 45.97 | 37.3 | -13.5 |
| 4 | 45.82 | 48.74 | 78.94 | 72.3 | 62.0 |
| 5 | 47.23 | 56.33 | 54.84 | 16.1 | -2.6 |
| 6 | 47.48 | 56.92 | 67.84 | 42.9 | 19.2 |
| 7 | 50.42 | 54.58 | 70.49 | 39.8 | 29.1 |
| 8 | 36.27 | 51.06 | 64.63 | 78.2 | 26.6 |
| 9 | 57.47 | 68.64 | 74.08 | 28.9 | 7.9 |
| 10 | 42.22 | 52.03 | 65.12 | 54.2 | 25.2 |
| 11 | 45.42 | 53.16 | 73.88 | 62.7 | 39.0 |
| 12 | 48.79 | 63.17 | 72.01 | 47.6 | 14.0 |
| 13 | 50.36 | 67.31 | 73.74 | 46.4 | 9.6 |
| 14 | 51.96 | 70.23 | 85.20 | 64.0 | 21.3 |
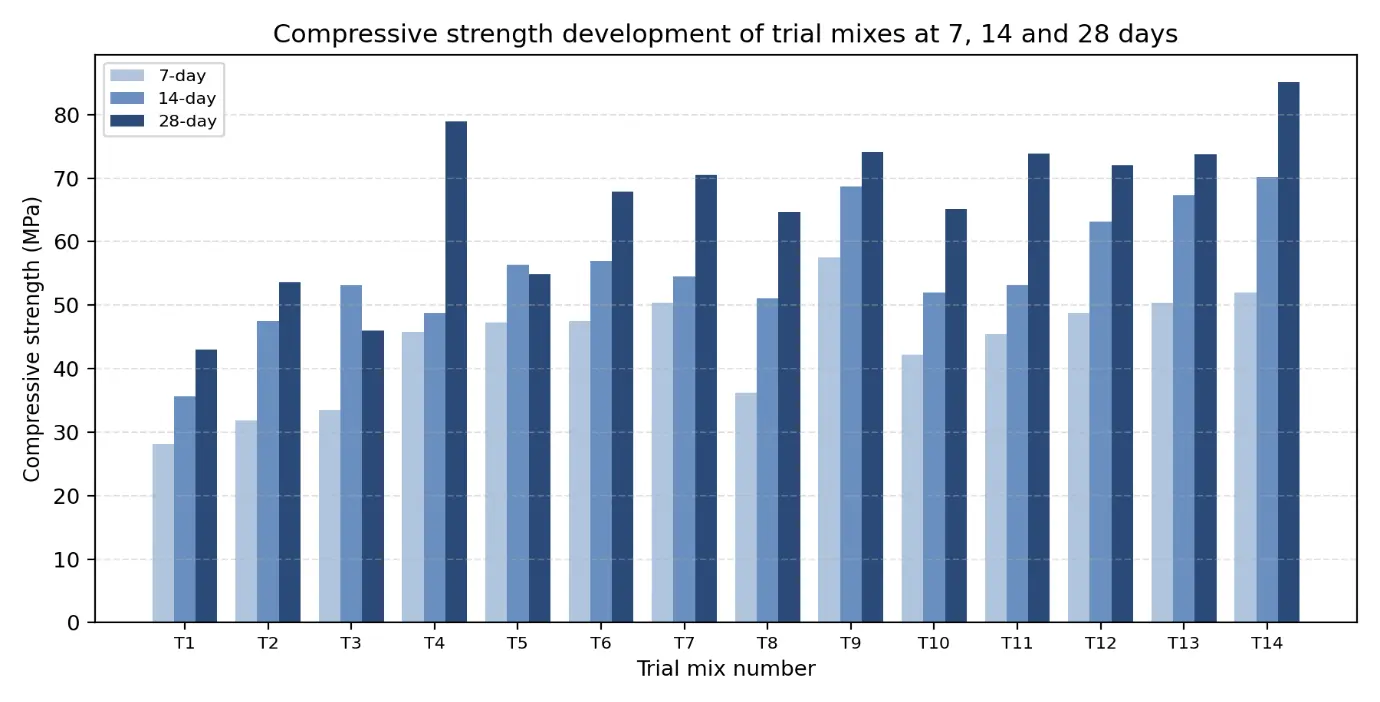
Figure 1: Compressive Strength Development of Trial Mixes at 7, 14 and 28 Days
Two trials (3 and 5) recorded a decrease in average strength between 14 and 28 days (-13.5% and -2.6% respectively), which is attributable to specimen-to-specimen variability at the 28-day age rather than a genuine loss of strength, since compressive strength of properly cured concrete does not regress with age; these values are retained in the analysis as measured but flagged as statistical outliers. Excluding these two trials, the average 14-to-28-day gain across the remaining twelve trials was 22.4%, consistent with the expected continuation of pozzolanic reaction beyond 14 days.
Influence of w/cm Ratio and Binder Content
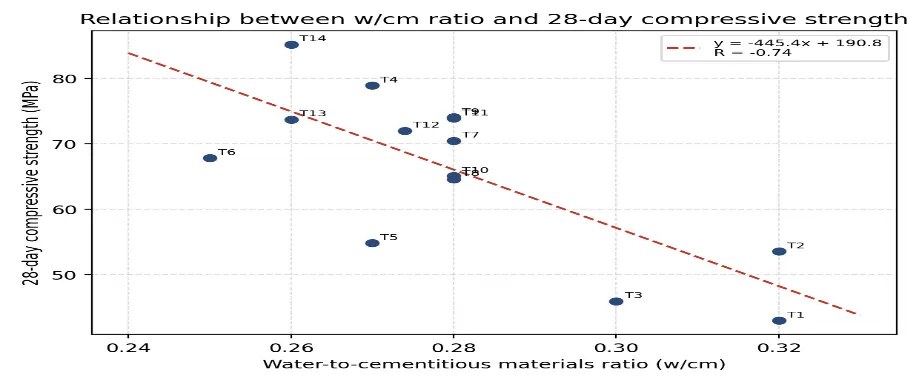
Figure 2: Relationship Between W/cm Ratio and 28-Day Compressive Strength
The relationship between w/cm ratio and 28-day compressive strength across the fourteen trials is shown in Figure 2. A negative linear correlation was obtained (Pearson r = -0.74), described by the regression equation: 28-day compressive strength (MPa) = -445.4 × (w/cm + 190.8)
Binder (cementitious material) content showed an even stronger positive association with 28-day strength (r = 0.83) than w/cm ratio alone, indicating that within this experimental range, increasing total binder content from 440 kg/m3 to 692 kg/m3 was the single most influential numerical parameter governing 28-day strength, ahead of the specific SCM combination used. The combination of the lowest w/cm ratio (0.25-0.26) with the highest binder content (630-692 kg/m3) in Trials 6, 13 and 14 consistently produced 28-day strengths above 67 MPa, confirming the compounding effect of these two parameters.
Influence of SCM Type and Combination
Trials 4 and 5, using cement with 10% silica fume only, achieved comparatively low SCM content (SCM = 10% of binder) yet still exceeded the M70 target in Trial 4 (78.94 MPa), demonstrating the strong early densification effect of silica fume alone. Trials 12-14, which used a ternary GGBS-metakaolin-silica fume blend (SCM = 31.6-35% of binder), produced the highest and most consistent 28-day strengths (72.01-85.20 MPa) among all trials, with Trial 14 (15% GGBS + 10% metakaolin + 10% silica fume, w/cm = 0.26) recording the maximum 28-day strength of 85.20 MPa in the data set - a 98.2% improvement over the lowest-performing Trial 1 (42.99 MPa, 20% SCM as fly ash + silica fume, w/cm = 0.32). This is consistent with a synergistic effect in which GGBS sustains longer-term pozzolanic reaction while metakaolin and silica fume accelerate early densification, and indicates that ternary blending combined with a low w/cm ratio was more effective than a high dosage of any single SCM in this data set.
Correlating SCM percentage alone (independent of binder content and w/cm ratio) with 28-day strength gave a weaker association (r = 0.46), reinforcing that SCM proportion by itself is a less reliable numerical predictor of strength than the combined effect of binder content and w/cm ratio.
Influence of Fine Aggregate Type
Trials 4 and 5 used an identical binder system (cement plus 10% silica fume at w/cm = 0.27) and differed only in fine aggregate type, allowing the isolated numerical effect of river sand versus crushed sand to be quantified. Table 4 summarises the comparison.
Table 4: Effect of Fine Aggregate Type on Compressive Strength (Trial 4 vs Trial 5)
| Trial | Binder system | Fine aggregate | 7-day (MPa) | 14-day (MPa) | 28-day (MPa) |
|---|---|---|---|---|---|
| 4 | Cement + 10% silica fume | River sand | 45.82 | 48.74 | 78.94 |
| 5 | Cement + 10% silica fume | Crushed sand | 47.23 | 56.33 | 54.84 |
At 28 days, the river-sand mix (Trial 4) achieved 78.94 MPa compared with 54.84 MPa for the crushed-sand mix (Trial 5) - a reduction of 30.5% attributable to fine aggregate type alone. Interestingly, the crushed-sand mix exhibited marginally higher strength at 7 and 14 days (+3.1% and +15.6% respectively), suggesting that the angular, higher-surface-area crushed sand particles improved early-age packing and bond, but that this advantage did not translate into superior long-term strength, possibly due to the higher water demand and microcracking potential associated with crushed sand at low w/cm ratios. A similar but smaller reversal in ranking is observed between Trials 7 and 8 (GGBS-silica fume/GGBS-fly ash systems with river and crushed sand respectively) and between Trials 9 and 10 (GGBS-only system), where river-sand trials again outperformed their crushed-sand counterparts at 28 days by 14.6% and 0% respectively, though the magnitude of the effect varied with binder composition.
CONCLUSIONS
1. Across fourteen M70-grade trial mixes combining fly ash, GGBS, silica fume and metakaolin at w/cm ratios of 0.25-0.32, 28-day compressive strength ranged from 42.99 MPa to 85.20 MPa (mean 65.95 MPa, standard deviation 12.39 MPa), demonstrating that binder composition and proportioning strongly govern the final strength attained for a fixed target grade.
2. Total binder content showed the strongest statistical association with 28-day strength (r = 0.83), followed by an inverse association with w/cm ratio (r = -0.74); the fitted relationship 28-day strength = -445.4 (w/cm) + 190.8 provides a first-order numerical estimate of strength for mixes within this w/cm range.
3. A ternary blend of 15% GGBS, 10% metakaolin and 10% silica fume at w/cm = 0.26 (Trial 14) produced the maximum 28-day strength of 85.20 MPa, a 98.2% improvement over the lowest-performing binary fly ash-silica fume mix (Trial 1, 42.99 MPa), indicating that ternary SCM blending combined with a low w/cm ratio is more effective than reliance on a single SCM at similar dosage.
4. SCM percentage alone was a comparatively weak predictor of 28-day strength (r = 0.46) when considered independently of binder content and w/cm ratio, underscoring that strength optimisation must consider all three parameters jointly rather than SCM dosage in isolation.
5. Replacing river sand with crushed sand under an identical binder system (Trial 4 vs Trial 5) reduced 28-day compressive strength by 30.5% (78.94 MPa to 54.84 MPa), despite crushed sand producing marginally higher early-age (7- and 14-day) strength, indicating that fine aggregate type has a measurable and age-dependent influence on strength development that should be accounted for explicitly in HSC mix design.
6. Two trials exhibited an apparent strength decrease between 14 and 28 days, attributed to specimen variability rather than genuine strength regression; excluding these outliers, the average 14-to-28-day strength gain across the remaining trials was 22.4%, consistent with continued pozzolanic reaction of the SCMs beyond 14 days.
REFERENCES


Darshana R. Sorte, Priyanka Pandey, Compressive Strength Development of High Strength Concrete Incorporating FLY ASH, GGBS, Silica Fume and Metakaolin, Int. J. in Engi. Sci., 2026, Vol 3, Issue 10, 11-17. https://doi.org/10.5281/zenodo.23081207
 10.5281/zenodo.23081207