
We use cookies to ensure our website works properly and to personalise your experience. Cookies policy
1Professor, Department of Mechanical Engineering, IJCE, Tutucorin, Tamilnadu, India
2Design Engineer, Precision Profile India, Chennai
The non-conventional machining method used to machine tough material involving complex profiles that are difficult to process by conventional processes. In this work, a hybrid aluminum metal matrix composite was formed with reinforcement by SiC and TWC. The composite materials have complex thermo physical properties because of the presence of different metals. It was machined using Wire Electrical Discharge machining (WEDM) for understanding the suitability of the composite to automotive and aerospace applications. The study also contains grain structure images that are very helpful in understanding the strength of the material. In order to achieve a good quality machining on the materials considered, the effect of few process parameters on Metal removal rate, Surface Finish and Kerf Width was studied. The experimental outcomes were optimized using the Grey relation analysis (GRA) approach. The results indicated that the Kerfwidth increases with the increase in current value, surface roughness increases with the increase in tool travel speed and MRR is greatly influenced by the tool travel speed. The best results were achieved for pulse on time of 15 µs, travel speed of 100 mm/min and current of 1A.
This machine (WEDM) is comparatively good process and its applications have grown rapidly in the field of intricate shape making. It is related to the application to manufacturing technology of the capacity of electrical discharges, under controlled distribution, to remove metal. The main aim of WEDM manufactures and users are to achieve better stability and higher productivity in the process. i.e., higher machining rate with desired accuracy and minimum surface damage. However, due to a large number of variables and the random nature of the process, even a highly skilled operator working with a state of the art WEDM is unable to achieve the optimal performance. In the present work, Aluminium based hybrid composite material is used as the work piece for studying the effect of process parameters. The outputs considered are MRR, SR and hardness of the machined work piece.
Vishal parashar et al (2010) proposed statistical and regression analysis of material removal rate (MRR) using design of experiments for WEDM operations. Experimentation was planned as per Taguchi’s L32 mixed orthogonal array. Each experiment has been performed under different cutting conditions of gap voltage, pulse ON time, pulse OFF time, wire feed and dielectric flushing pressure. From experimental results, the MRR was determined for each machining performance criteria. Analysis of variance (ANOVA) technique was used to find out the variables affecting the MRR. Assumptions of ANOVA were discussed and carefully examined using analysis of residuals. Variation of the MRR with machining parameters was mathematically modelled by using the regression analysis method. Krishna Mohona Rao et al (2010) investigated for optimizing the hardness of surface produced in die sinking electric discharge machining (EDM) by considering the simultaneous effect of various input parameters. The experiments were carried out on Ti6A14V, HE15, 15CDV6 and M-250 by varying the peak current and voltage and the corresponding values of hardness were measured. Multi perceptron neural network models were developed using Neuro solution package. Genetic Algorithm concept is used to optimize the weighting factors of the network. It was observed that the developed model is within the limits of the agreeable error when experimental and network model results were compared. It was further observed that the error when the network is optimized by genetic algorithm has come down to less than 2%. Sensitivity analysis was also done to find the relative influence of factors on the performance measures.
S.S. Mahapatra et al (2007) made an attempt to determine the important machining parameters for performance measures like MRR, surface finish and Kerf in WEDM process. Factors like discharge current, pulse duration and dielectric flow rate and their interactions have been found to play a significant role in rough cutting operations for maximization of MRR, minimization of surface roughness and minimization of cutting width using Taguchi’s experimental design method. In this study, the relationships between control factors and response are established by means of non-linear regression analysis and Genetic algorithm is employed to optimize the wire electrical discharge machining process with multiple objectives. Ramakrishnan et al (2006) described the multi objective optimization of the WEDM process using parametric design of Taguchi methodology. The effect of various machining parameters such as pulse duration, Wire tension, delay time, wire feed and ignition current intensity has been studied in machining heat - treated tool steel. It was identified that the pulse on time and ignition current intensity have influenced more than the other parameters considered in the study. Material removal rate, surface roughness and wire wear ratio were improved concurrently by multi objective optimization tool.
Dinesh et al (2017) studied about the Grey relation analysis optimization of centreless grinding operation of Magnesium alloy. They have analyzed and obtained the optimum level of input parameters for achieving the best output. Godwin et al (2017) investigated the performance of alternate fuel in IC engines and investigated about the effect of various process parameters. They have used the Grey Relation Analysis approach for achieving the best efficiency of the process. Radhakrishnan et al (2017) experimented electrical discharge machining of aluminum metal matrix and analyzed the effect of various input parameters on the output. The analysis was done on the basis of response surface methodology and the prediction equation was developed for material removal rate and surface roughness.
Keith et al (2007) studied bout the optimum cutting parameters in WEDM based on work piece surface temperature distribution. FEM model was developed to compute thickness of the temperature affected layers for different cutting parameters based on a critical temperature value. Through minimizing the thickness of the temperature affected layers and satisfying a certain cutting speed, a set of cutting process parameters was determined for the work piece manufacture. The analyzed results have a good agreement with experimental results. Singh P et al (2017) analysed about the WEDM by Finite element analysis approach. The process generated surfaces having poor properties such as high tensile residual stresses, high surface roughness, presence of micro-cracks and micro voids. The conventional machining process varies the former properties at different levels of controlling parameters. The aim of FEA simulation was to understand the transient thermal and structural simulation work that has been a three-dimensional finite element model with newer materials to predict the temperature distribution, Total heat flux at different pulses of time as well as stress distribution in WEDM wire electrode. Fuzhu Han et al (2007) studied the influence of the machining parameters on surface roughness experimentally in WEDM. It was found that surface roughness can be improved by decreasing both pulse duration and discharge current. When the pulse energy per discharge is constant, short pulses and long pulses will produce the same surface roughness but dissimilar surface morphology and different material removal rates. Moreover, short pulse duration with high peak value can generate better surface roughness, which a long pulse can’t aciheve. It was also found that reversed polarity machining with appropriate pulse energy can improve the machined surface roughness a little better compared with the normal polarity in finishing, but some copper from the wire electrode is accreted on the machined surface.
The work material chosen for the project work is an Aluminum based hybrid composite comprising of base Aluminum metal reinforced with SiC (2.5% on weight basis) and TWC (2.5% on weight basis). The material mainly focus on providing a light weight covering for the automotive and aerospace vehicles without any compromise in strength. The SiC used is of the order 120 ±10µm size and the TWC powder of 100 ±10µm mesh. The composite was fabricated through the stir casting process at a temperature range of 700 deg Celsius for melting the aluminum ingots and later the powders of SiC & TWC was added. The stirring process was done at the rate of 200rpm for 10 minutes to create a proper distribution throughout the base metal.
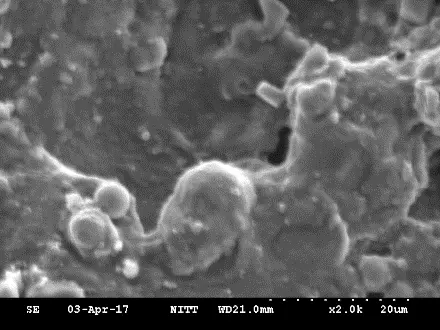
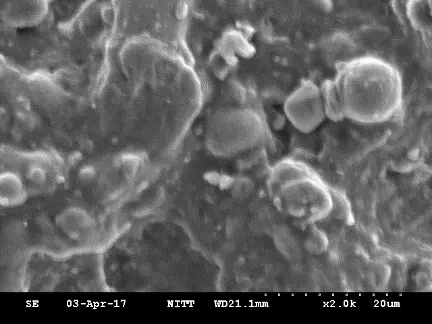
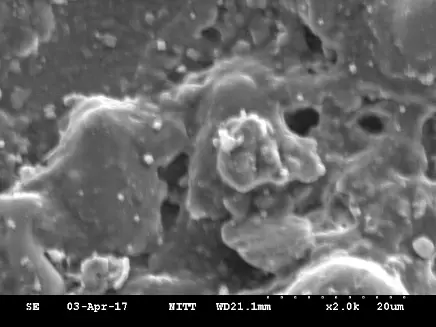
Figure 1 – SEM images of the composite
The figure 1 shows the Scanning Electron Microscope images of the casted composite material. The composite is cleaned and samples of 10mm x 10mm is prepared as per the requirement of the SEM imaging procedure for obtaining the microscopic structures. The images are observed based on the triangulation procedure with equal distance between the points of observation in order to obtain uniformity in results. It can be seen that there is proper distribution of the reinforcement material inside the aluminum base metal. There is no agglomeration of atoms due to the presence of SiC and TWC particles inside the material lattice. Almost uniform grain size can be observed without any large grain boundary. However, there may be some spaces, where the material does not bind properly. This could be seen as dark void spots in the figure 1.
The machining operation was carried out in the SODICK AG600L wire cut electrical discharge machine. This research work has focused to find out the effect of machining parameters like pulse on time, tool travel speed and current on material removal rate (MRR), Surface roughness (SR) and Kerfwidth (Kerf). The Zn-Coated Brass wire of 0.25 mm diameter is used for machining. Decision can be made on independent variables for achieving maximum MRR, higher surface finish and smaller Kerfwidth values. All the experimental data is presented in table 1.
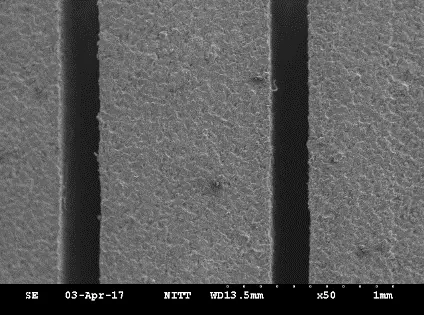
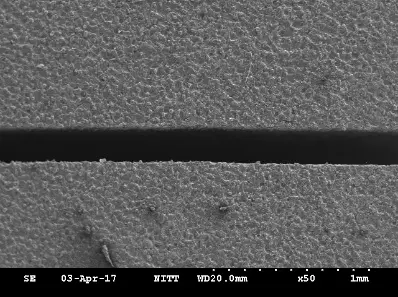
Figure 2 – SEM images of the machined composite at 50 magnification
The machined work pieces were etched properly without causing any changes to the material structure and prepared for obtaining SEM images that are presented in the figure 2. It is evidential that there is no layer separation of the composite even after machining with the high current levels. Further investigation can be being carried out with higher magnification of the machined object to understand the strength and its ability for using in aerospace applications. The corresponding spots were further examined with higher magnification of 2000 times for structural changes in material by the machining process. The same is shown in figure 3. The machining process involves material erosion by high voltage spark production. Due to this high amount heat will be produced in the machining of the composite material and hence changes in the lattice structure may be produced.
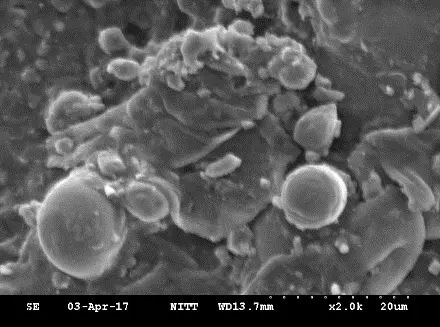
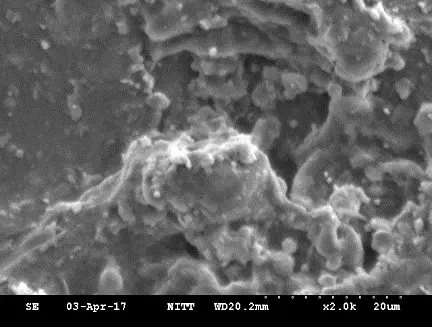
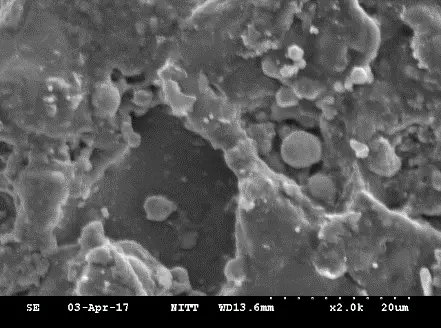
Figure 3 – SEM images of the machined composite at 2000 magnification
Table 1 – Experimental Input and output values
|
Run order |
Pulse On Time (µs) |
Travel Speed (mm/min) |
Current (Amp) |
Kerf (mm) |
Surface Roughness (µm) |
MRR (g/min) |
|
1 |
15 |
100 |
1 |
0.26 |
0.39 |
0.0813 |
|
2 |
15 |
100 |
2 |
0.266 |
0.14 |
0.0832 |
|
3 |
15 |
100 |
3 |
0.279 |
0.13 |
0.0873 |
|
4 |
15 |
150 |
1 |
0.266 |
0.26 |
0.1248 |
|
5 |
15 |
150 |
2 |
0.266 |
0.23 |
0.1248 |
|
6 |
15 |
150 |
3 |
0.26 |
0.33 |
0.1212 |
|
7 |
15 |
200 |
1 |
0.279 |
0.46 |
0.1745 |
|
8 |
15 |
200 |
2 |
0.266 |
0.68 |
0.1664 |
|
9 |
15 |
200 |
3 |
0.279 |
0.27 |
0.1745 |
|
10 |
20 |
100 |
1 |
0.272 |
0.34 |
0.085 |
|
11 |
20 |
100 |
2 |
0.279 |
0.2 |
0.0872 |
|
12 |
20 |
100 |
3 |
0.296 |
0.25 |
0.0926 |
|
13 |
20 |
150 |
1 |
0.266 |
0.43 |
0.1248 |
|
14 |
20 |
150 |
2 |
0.272 |
0.34 |
0.1276 |
|
15 |
20 |
150 |
3 |
0.26 |
0.54 |
0.1212 |
|
16 |
20 |
200 |
1 |
0.266 |
0.84 |
0.1664 |
|
17 |
20 |
200 |
2 |
0.266 |
0.65 |
0.1664 |
|
18 |
20 |
200 |
3 |
0.286 |
0.44 |
0.1789 |
|
19 |
25 |
100 |
1 |
0.266 |
0.83 |
0.0832 |
|
20 |
25 |
100 |
2 |
0.291 |
0.84 |
0.091 |
|
21 |
25 |
100 |
3 |
0.277 |
0.31 |
0.0866 |
|
22 |
25 |
150 |
1 |
0.285 |
0.29 |
0.1337 |
|
23 |
25 |
150 |
2 |
0.292 |
0.76 |
0.137 |
|
24 |
25 |
150 |
3 |
0.272 |
0.77 |
0.1276 |
|
25 |
25 |
200 |
1 |
0.242 |
0.62 |
0.1514 |
|
26 |
25 |
200 |
2 |
0.292 |
0.92 |
0.1827 |
|
27 |
25 |
200 |
3 |
0.274 |
0.89 |
0.1714 |
From the figure 3, it can be easily observed that the atoms got clustered owing to the high temperature generated during the machining process. The atoms grain boundary has gotten enlarged post machining. The grains got attached with each other and hence got more bonded. But, the grain bonding is not uniform when getting attached with other particles. There may be some void spots generated after machining the material and causes for reduction in strength. The material removal process is spark erosion and hence smooth surface can be produced only under the condition of low current situation. The lesser current will reduce the surface deterioration of the machined parts. Thus the cracks formation may be completely avoided.
All the experimental results were obtained as per the design proposed in table 1. The outputs measured were the average of two trials, where all the process parameters were kept the same for repetition. The Grey Relation Analysis was used to identify the optimum process parameters to be used with the work material.
Table 2 – Determination of Grey relation grade
|
Run order |
Normalized |
Grey Relation Coefficient |
Grey Relation Grade |
||||
|
Kerf |
SR |
MRR |
Kerf |
SR |
MRR |
||
|
1 |
0.667 |
0.671 |
1.000 |
0.497 |
0.501 |
1.000 |
1.998 |
|
2 |
0.556 |
0.987 |
0.981 |
0.426 |
0.963 |
0.946 |
2.335 |
|
3 |
0.315 |
1.000 |
0.941 |
0.325 |
1.000 |
0.848 |
2.173 |
|
4 |
0.556 |
0.835 |
0.571 |
0.426 |
0.667 |
0.435 |
1.528 |
|
5 |
0.556 |
0.873 |
0.571 |
0.426 |
0.723 |
0.435 |
1.584 |
|
6 |
0.667 |
0.747 |
0.607 |
0.497 |
0.566 |
0.456 |
1.519 |
|
7 |
0.315 |
0.582 |
0.081 |
0.325 |
0.441 |
0.264 |
1.031 |
|
8 |
0.556 |
0.304 |
0.161 |
0.426 |
0.322 |
0.282 |
1.030 |
|
9 |
0.315 |
0.823 |
0.081 |
0.325 |
0.651 |
0.264 |
1.240 |
|
10 |
0.444 |
0.734 |
0.964 |
0.373 |
0.554 |
0.900 |
1.827 |
|
11 |
0.315 |
0.911 |
0.942 |
0.325 |
0.788 |
0.850 |
1.964 |
|
12 |
0.000 |
0.848 |
0.889 |
0.248 |
0.685 |
0.748 |
1.680 |
|
13 |
0.556 |
0.620 |
0.571 |
0.426 |
0.465 |
0.435 |
1.326 |
|
14 |
0.444 |
0.734 |
0.543 |
0.373 |
0.554 |
0.420 |
1.346 |
|
15 |
0.667 |
0.481 |
0.607 |
0.497 |
0.389 |
0.456 |
1.342 |
|
16 |
0.556 |
0.101 |
0.161 |
0.426 |
0.269 |
0.282 |
0.977 |
|
17 |
0.556 |
0.342 |
0.161 |
0.426 |
0.334 |
0.282 |
1.042 |
|
18 |
0.185 |
0.608 |
0.037 |
0.288 |
0.457 |
0.255 |
1.000 |
|
19 |
0.556 |
0.114 |
0.981 |
0.426 |
0.271 |
0.946 |
1.644 |
|
20 |
0.093 |
0.101 |
0.904 |
0.267 |
0.269 |
0.775 |
1.311 |
|
21 |
0.352 |
0.772 |
0.948 |
0.337 |
0.592 |
0.863 |
1.792 |
|
22 |
0.204 |
0.797 |
0.483 |
0.293 |
0.620 |
0.390 |
1.302 |
|
23 |
0.074 |
0.203 |
0.451 |
0.263 |
0.293 |
0.375 |
0.931 |
|
24 |
0.444 |
0.190 |
0.543 |
0.373 |
0.289 |
0.420 |
1.082 |
|
25 |
1.000 |
0.380 |
0.309 |
1.000 |
0.347 |
0.323 |
1.670 |
|
26 |
0.074 |
0.000 |
0.000 |
0.263 |
0.248 |
0.248 |
0.759 |
|
27 |
0.407 |
0.038 |
0.111 |
0.358 |
0.255 |
0.271 |
0.884 |
The Grey relational analysis (GRA) is a method of measuring the degree of approximation among sequences according to the Grey Relational Grade. The measured output values of the experiment are normalized in the range between 0 and 1. The optimization of the complicated multiple performance characteristics can be converted into optimization of single grey relational grade. If the factors goal and direction are different, then the data must be pre–processed to a group of sequence called “grey relational generation”. Data pre–processing is a process of transferring the original sequence to a comparable sequence. For this purpose the experimental results are normalized in the range between zero and one. The normalization can be done in various forms and the following equations 1 & 2 are used.
For “Larger the better”,
For “Smaller the better”,
The Grey relation coefficient GRC) and Grades (GRG) were calculated for the machining data obtained following the standard procedure of GRA. The processed values of the experimental results were provided in table 2. From the GRG, the optimized value of the machining parameters to achieve the objectives can be identified. The optimum process parameters are obtained from the average value of GRG for each level of the input parameters as shown in figure 4.
The average value of each parameter according to the various levels are shown in figure 4. The optimum parameter combination for obtaining higher MRR, Lower SR and Kerfwidth is identified from it. The levels with larger values of each parameter is considered as the optimum. Hence first level of all the parameters should be used to achieve the expected outcomes. Thus the multi objective function with various direction of the output is reframed as a single objective function and solved.
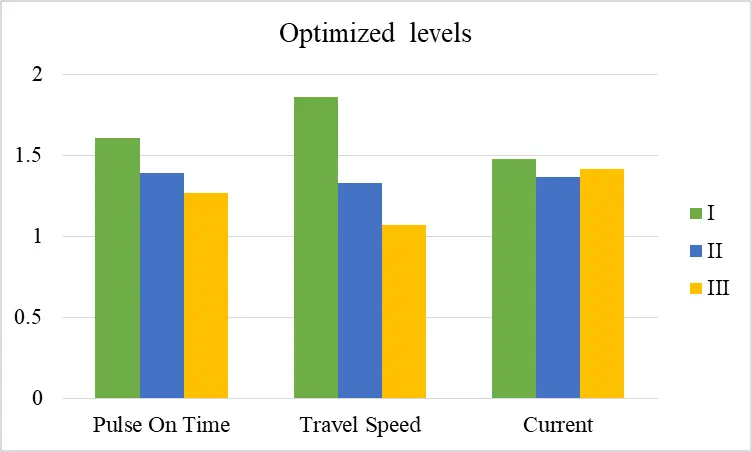
Figure 4 – Optimized levels of the machining process
The hybrid aluminium metal matrix composite was formed using the stir casting method with the reinforcement of SiC and TWC. The SEM images were taken after the casting of composite. The machining operation was done as per the plan and the following results were obtained.
The optimum parameter for achieving the best solution is given for pulse on time of 15 µs, travel speed of 100 mm/min and current of 1 A.
REFERENCES


S. Venkatesan, V. Priyadharshan, Analysis and optimization of Wire Electric Discharge Machining of Teak Wood Charcoal reinforced Aluminium Hybrid composites, Int. J. in Engi. Sci., 2026, Vol 3, Issue 7, 20-28. https://doi.org/10.5281/zenodo.21204739
 10.5281/zenodo.21204739